I write software for a dispatch desk, a family and a homelab.
I'm John. I work on a dispatch communications desk and I've been programming since a copy of Borland Turbo C for DOS. C# is the language I keep coming back to. At home I run a homelab on Proxmox and build embedded projects.
How it startedEducationBachelor of Science in Information Systems, summa cum laude. The City University of New York.
- 1
 CommsHub
The operations platform a dispatch desk runs on
- 2
 LM Dashboard
Start page and uptime monitor for a home network
- 3
 FamilyMatters
Calendar, chores and rewards for one family
- 4
 CaddyMonWeb
Live view of the traffic hitting every site on my server
- 5
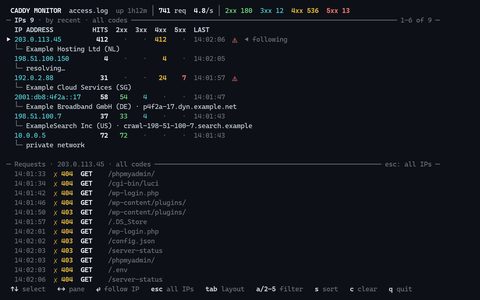 CaddyMon
The same view, in a terminal
- 6
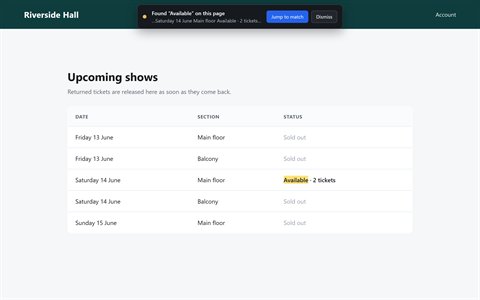 Page String Watcher
Edge extension that watches open tabs for words you pick
CommsHub
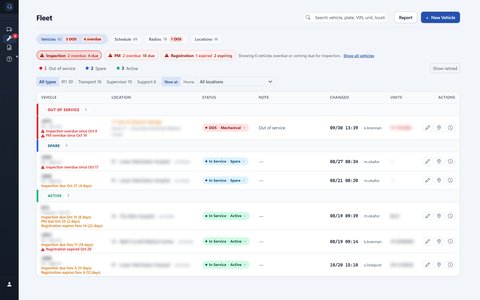
The operations platform a busy transport dispatch desk runs on. It replaced spreadsheets, email threads and paper forms, and when one person saves a change, everyone else on the desk sees it straight away.
- Type
- Operations platform
- Status
- In daily use since Feb 2025
- Built with
- C# and Blazor Server
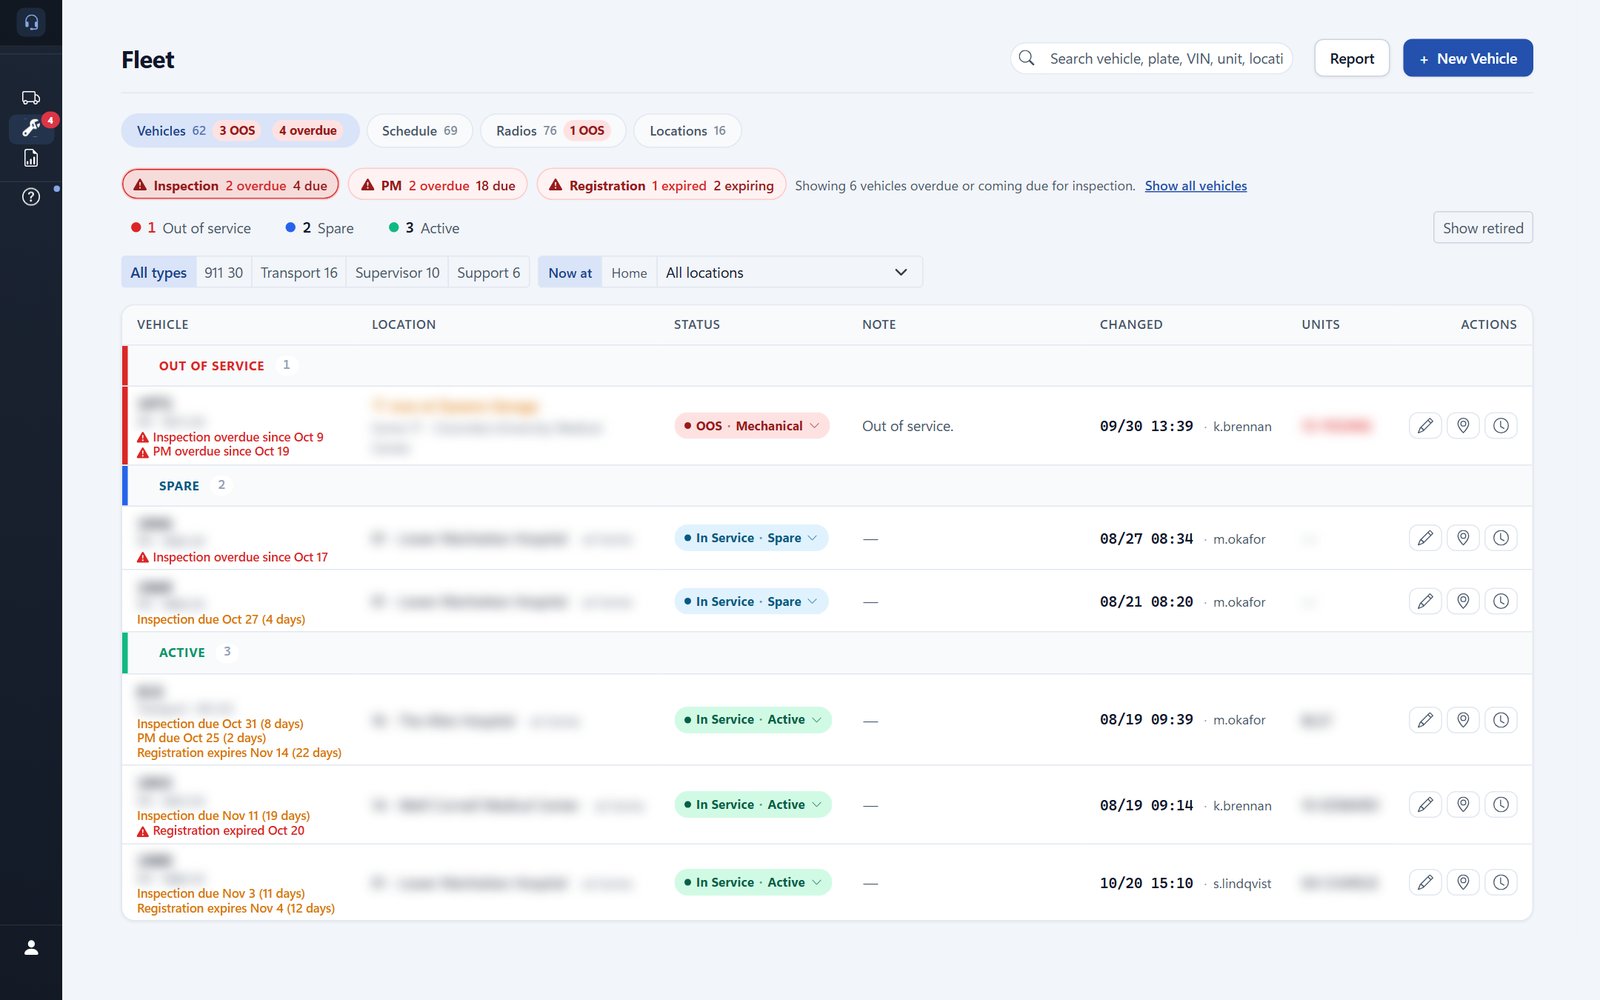
- Counts of vehicles out of service, overdue and coming due.
- A note says what the list is filtered to, with a link to show all vehicles.
- Each vehicle's next inspection, PM and registration, in orange when due and red when late.
- Each vehicle's status. Taking one out of service needs a reason.
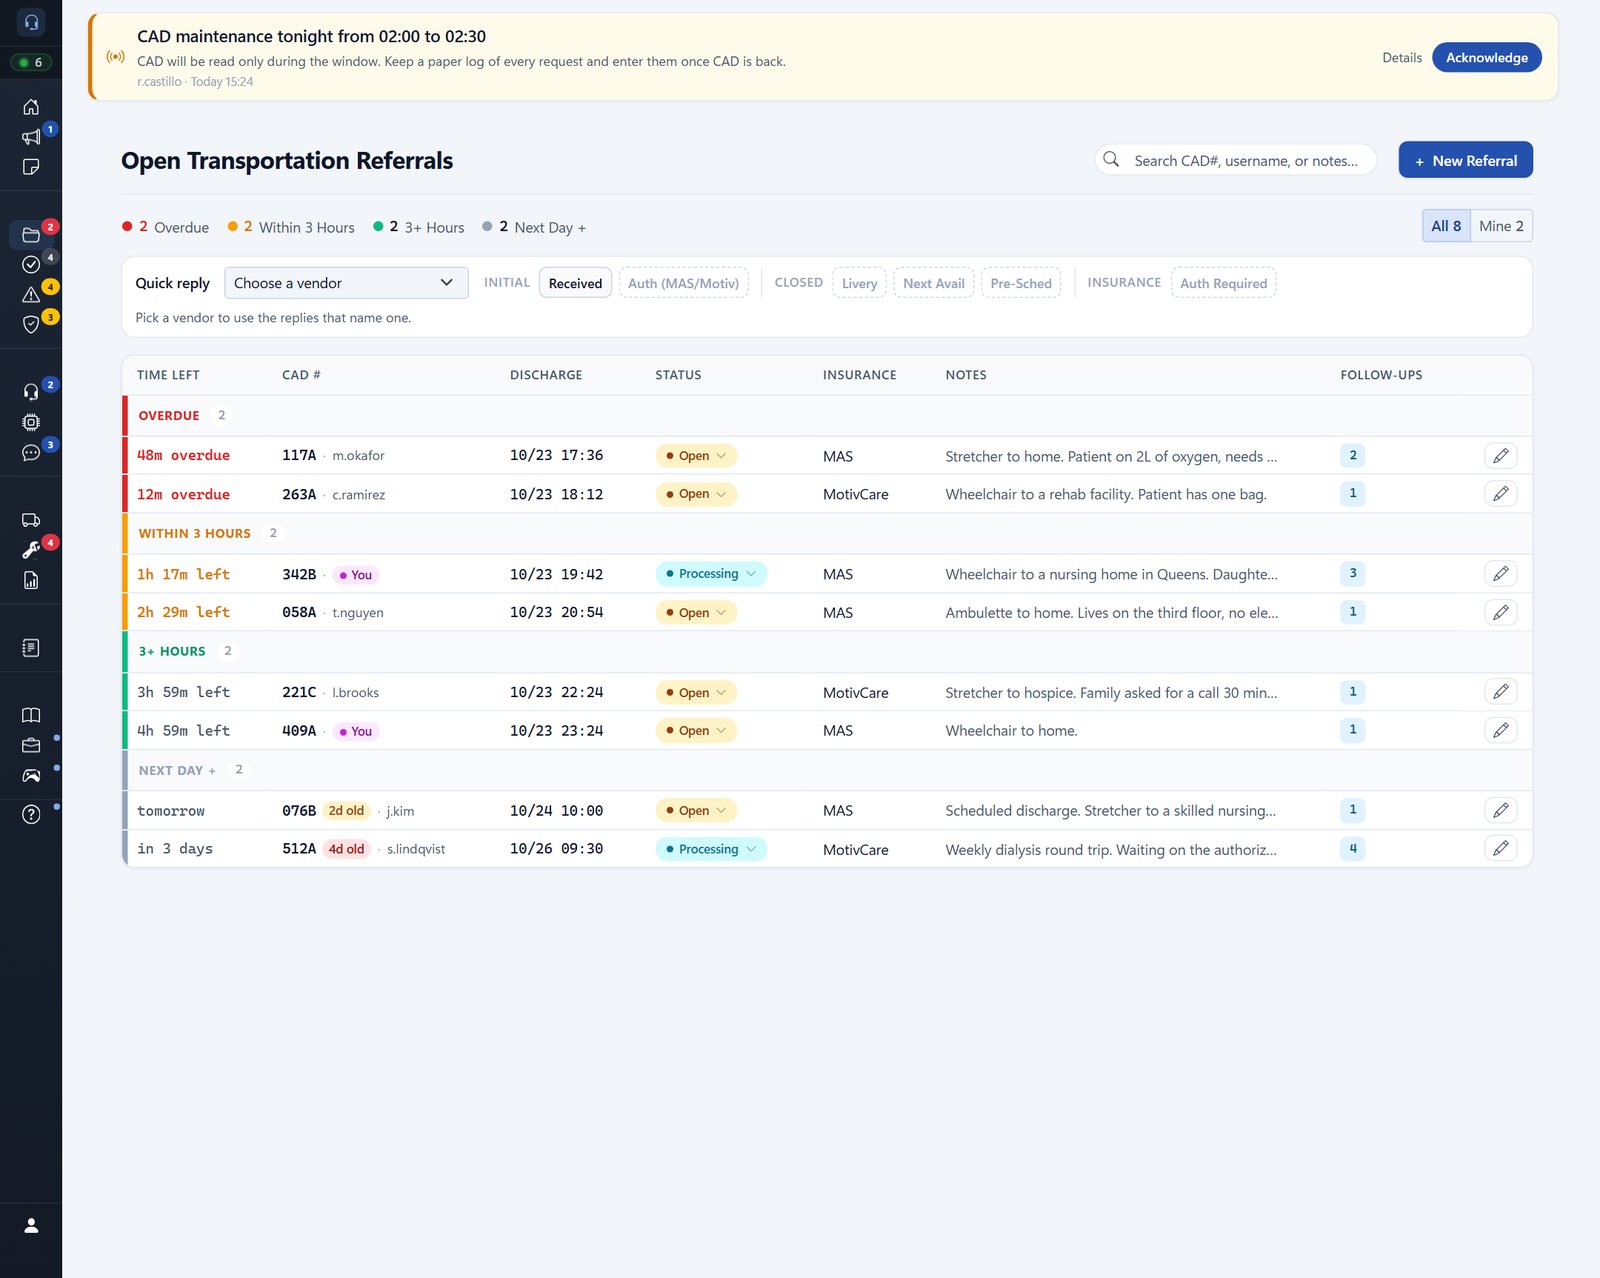
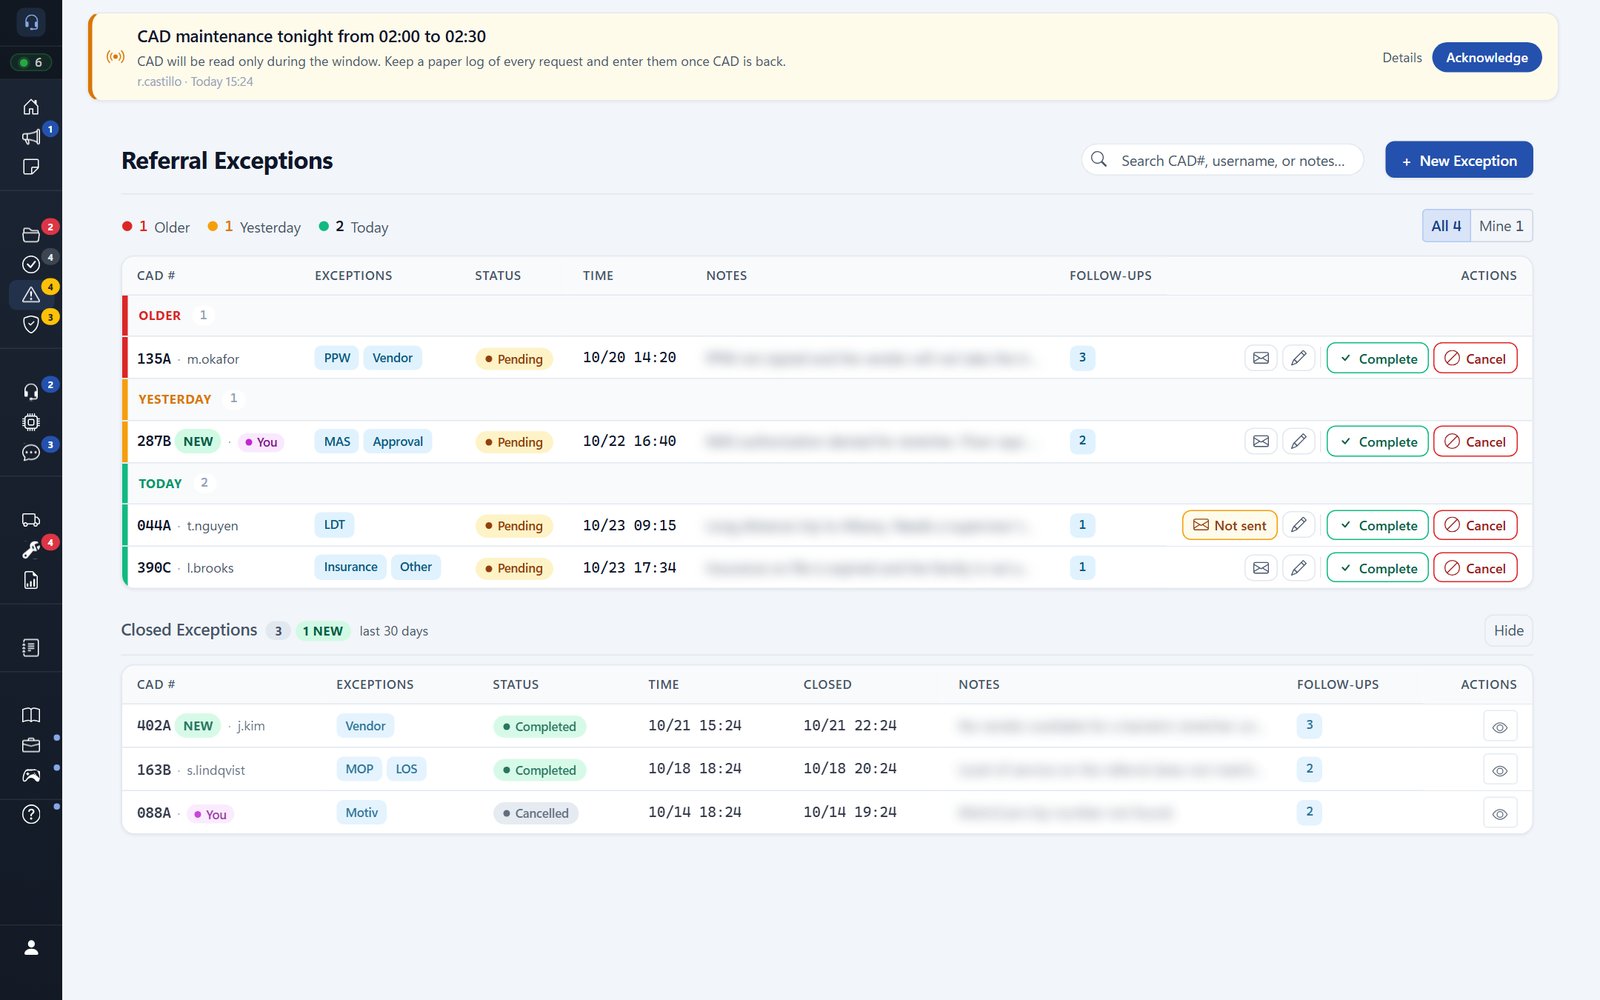
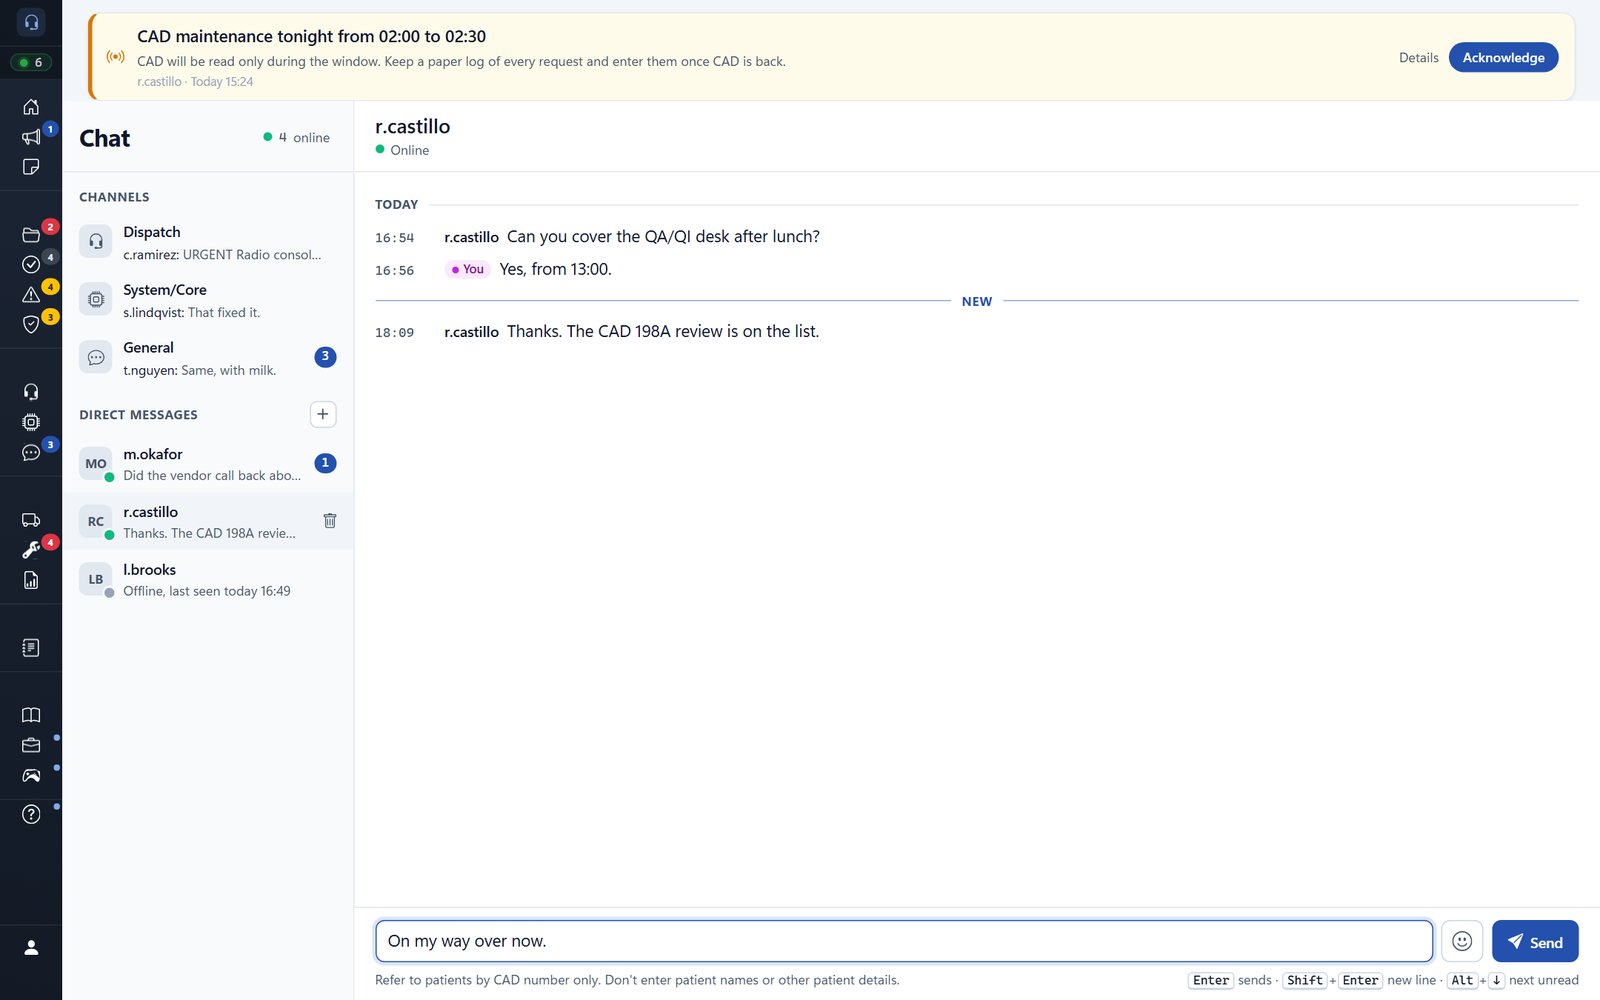
- Transport referrals sorted by time left, each with a follow-up thread and a quick-reply generator. Admins edit its vendors and templates in the app itself.
- Builds the daily crew rundown from the scheduling system's CSV export. A rundown is a safety document, so it only places a crew member on a unit when the match is exact.
- Tracks vehicles, radios and inspections, with a full history. Taking anything out of service needs a reason, and a weekly email lists what's overdue.
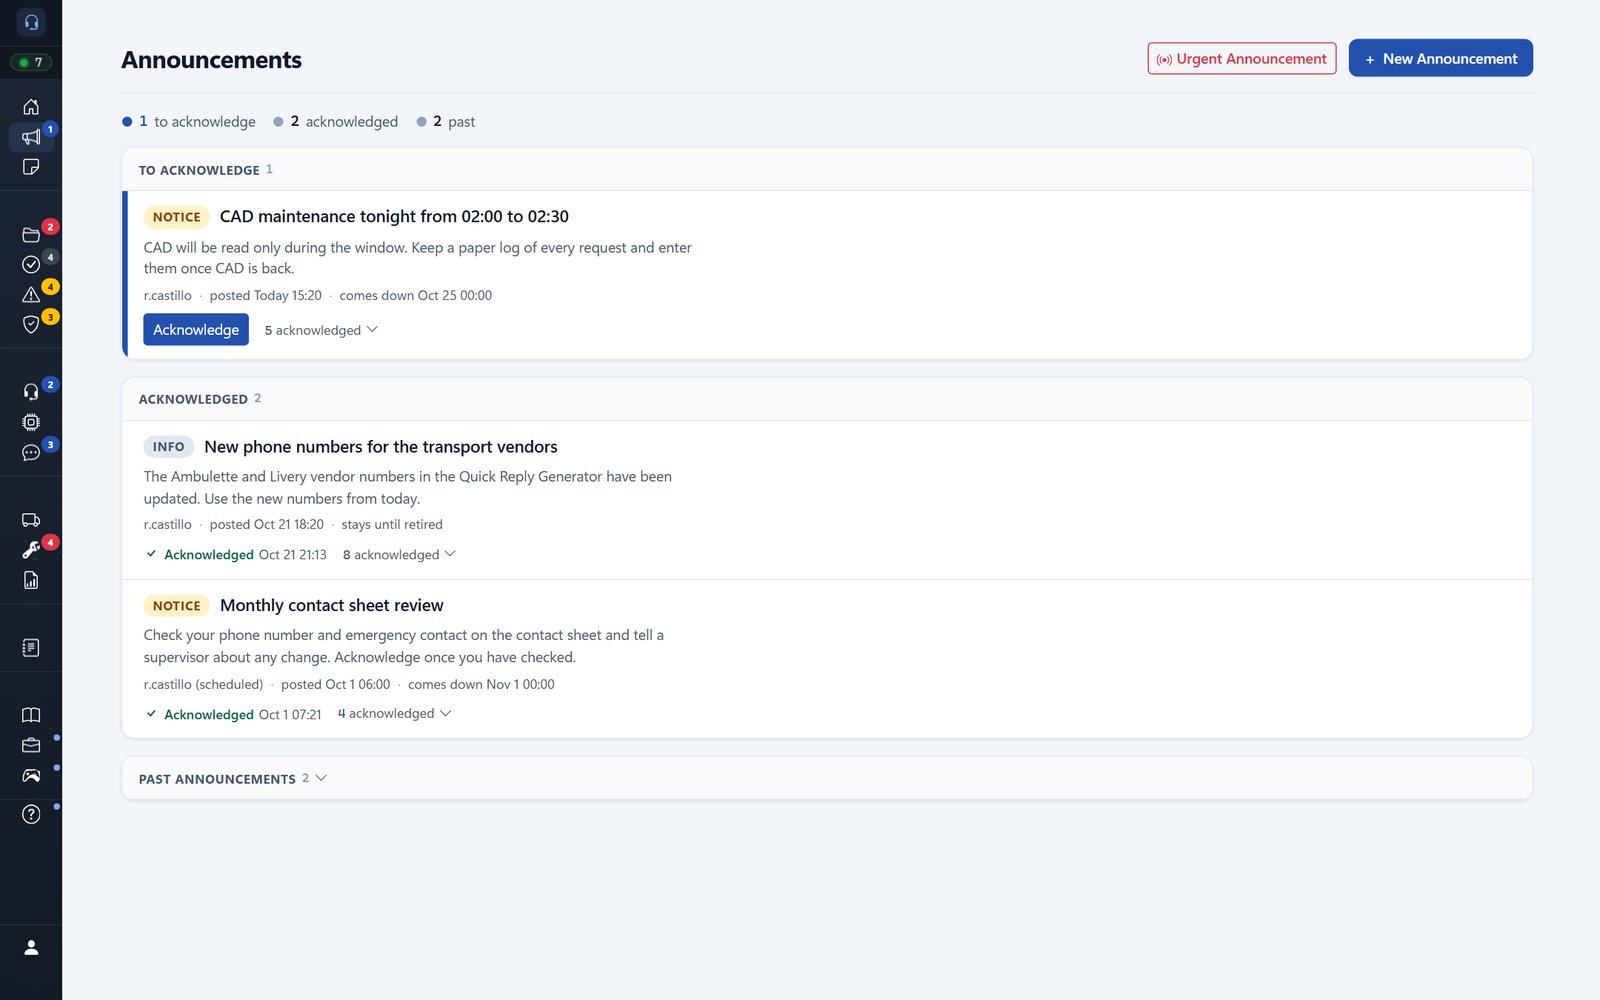
- Announcements with a roster of who has read them. Urgent ones also post to the Dispatch chat and flag the browser tab.
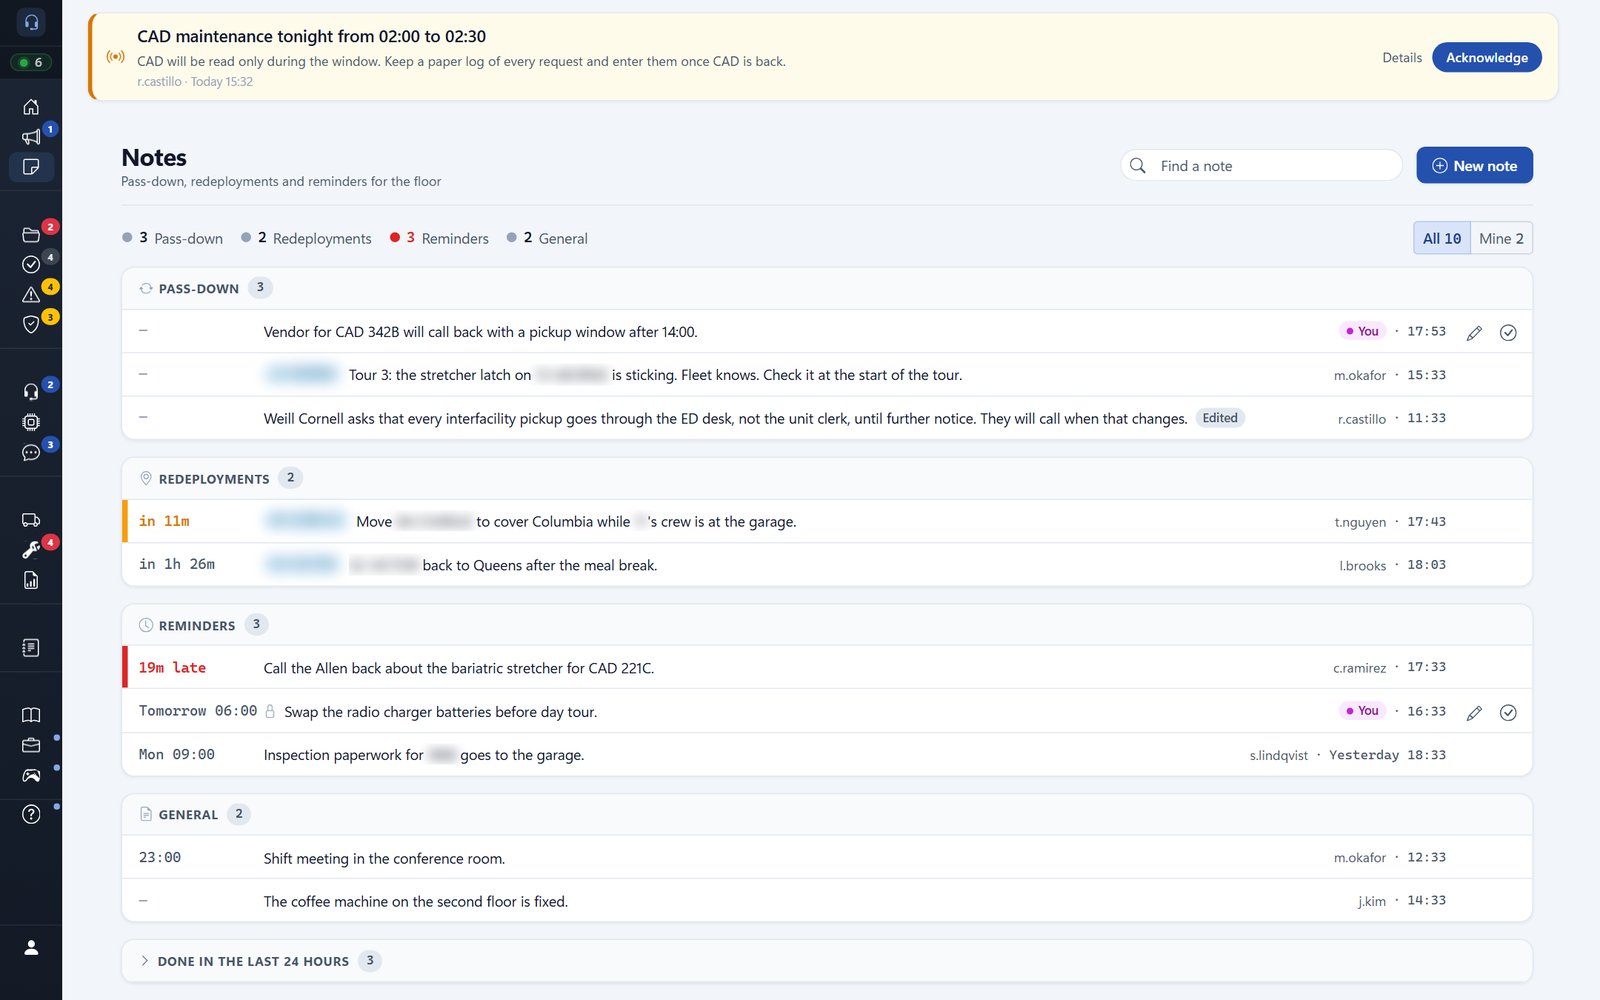
- A shared Notes board for pass-down, redeployments and reminders. Only the person who posted a note can change it. A note with a time counts down for everyone, turning amber 15 minutes before and red once it's due.
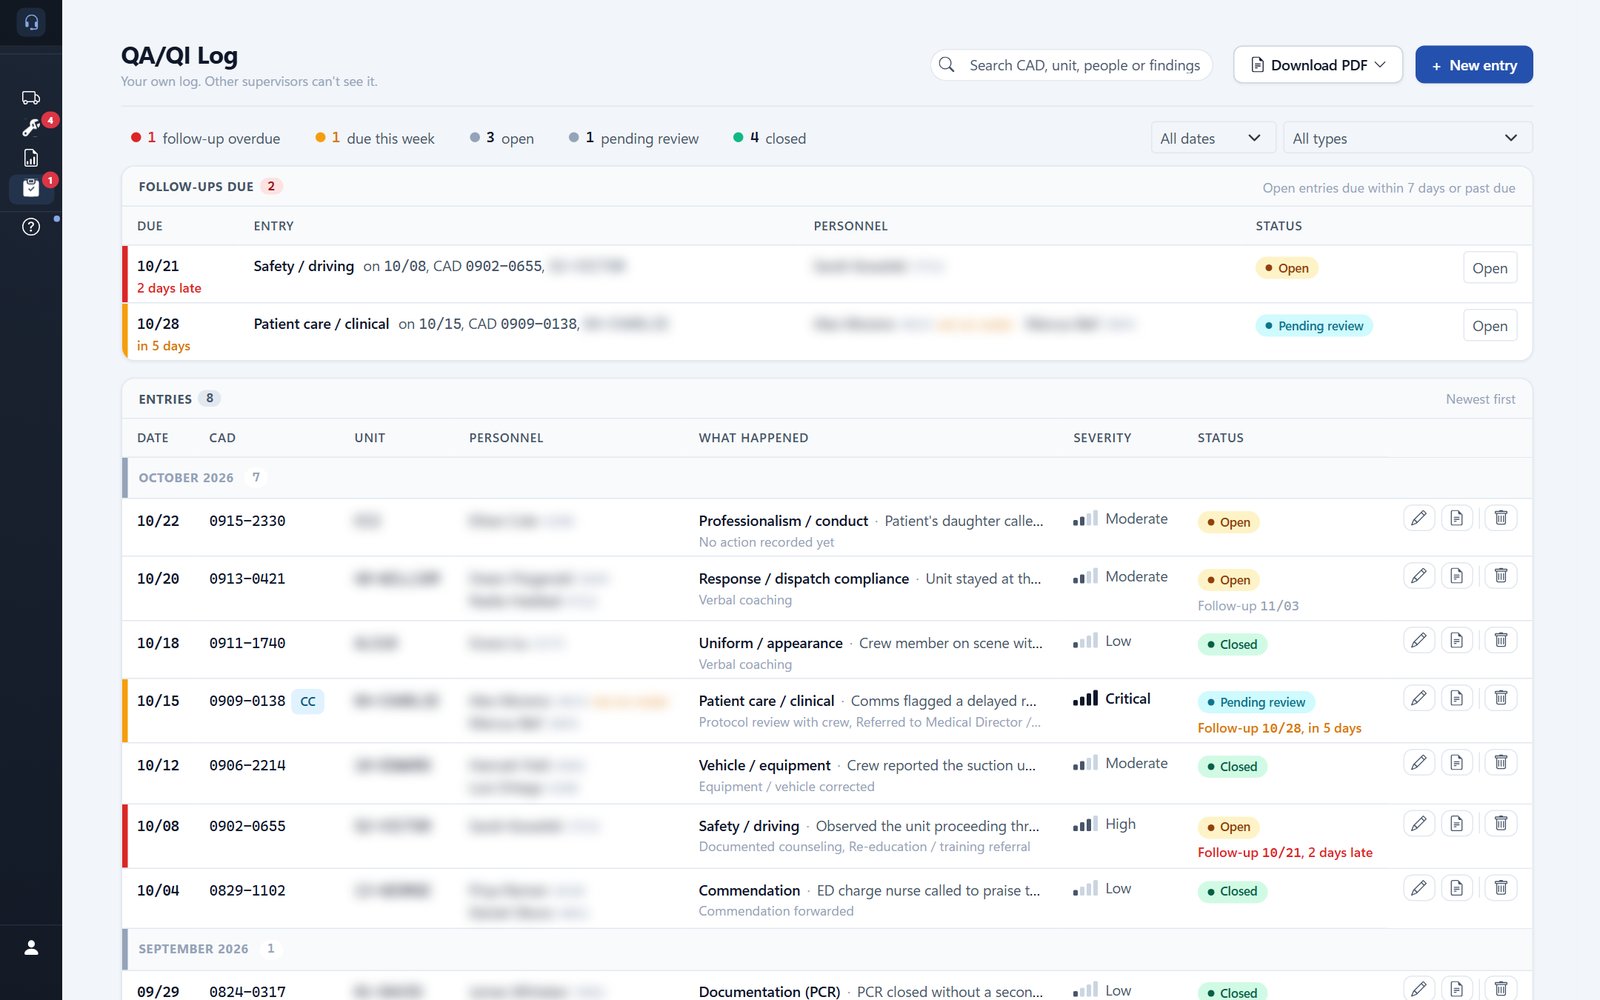
- QA/QI requests that only the person who filed them and supervisors can see. The server checks that on every read and write, badge counts included.
- Several hundred unit tests and a browser test suite run on every change.
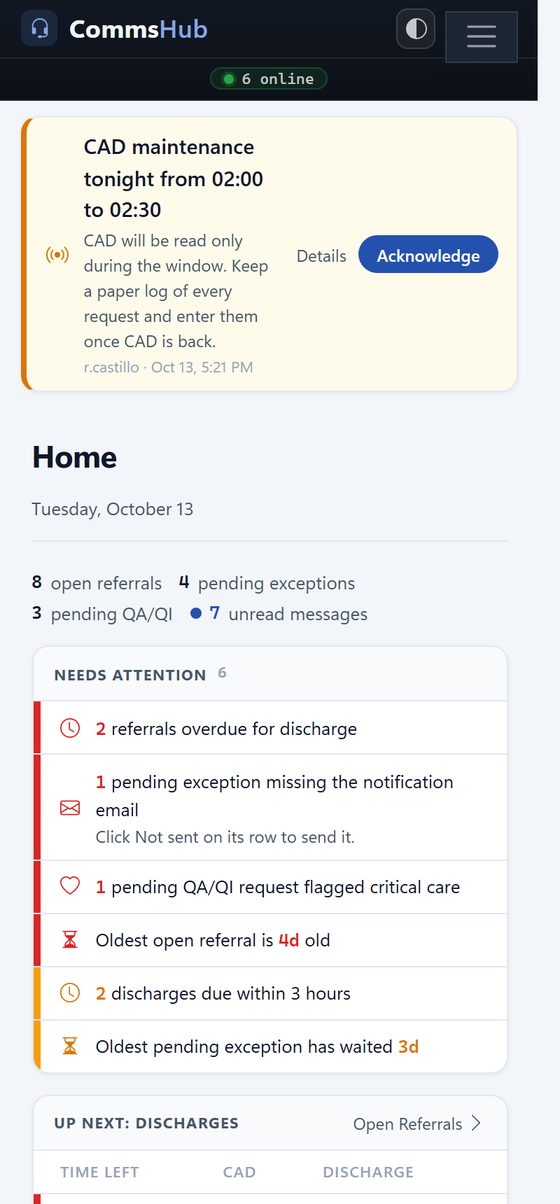
NoteScreenshots show example data only: made-up names, units, hospitals and messages.
LM Dashboard
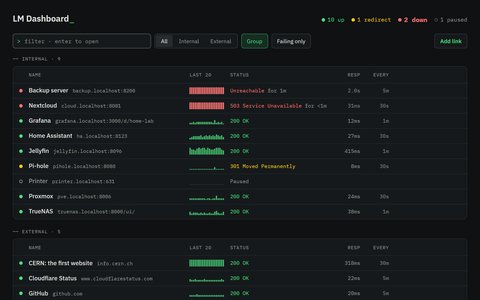
A start page and uptime monitor for the services on a home network, styled after old line-mode terminals. Each link is checked on its own schedule, and the page updates as the results come in.
- Type
- Uptime monitor
- Runs
- Self-hosted
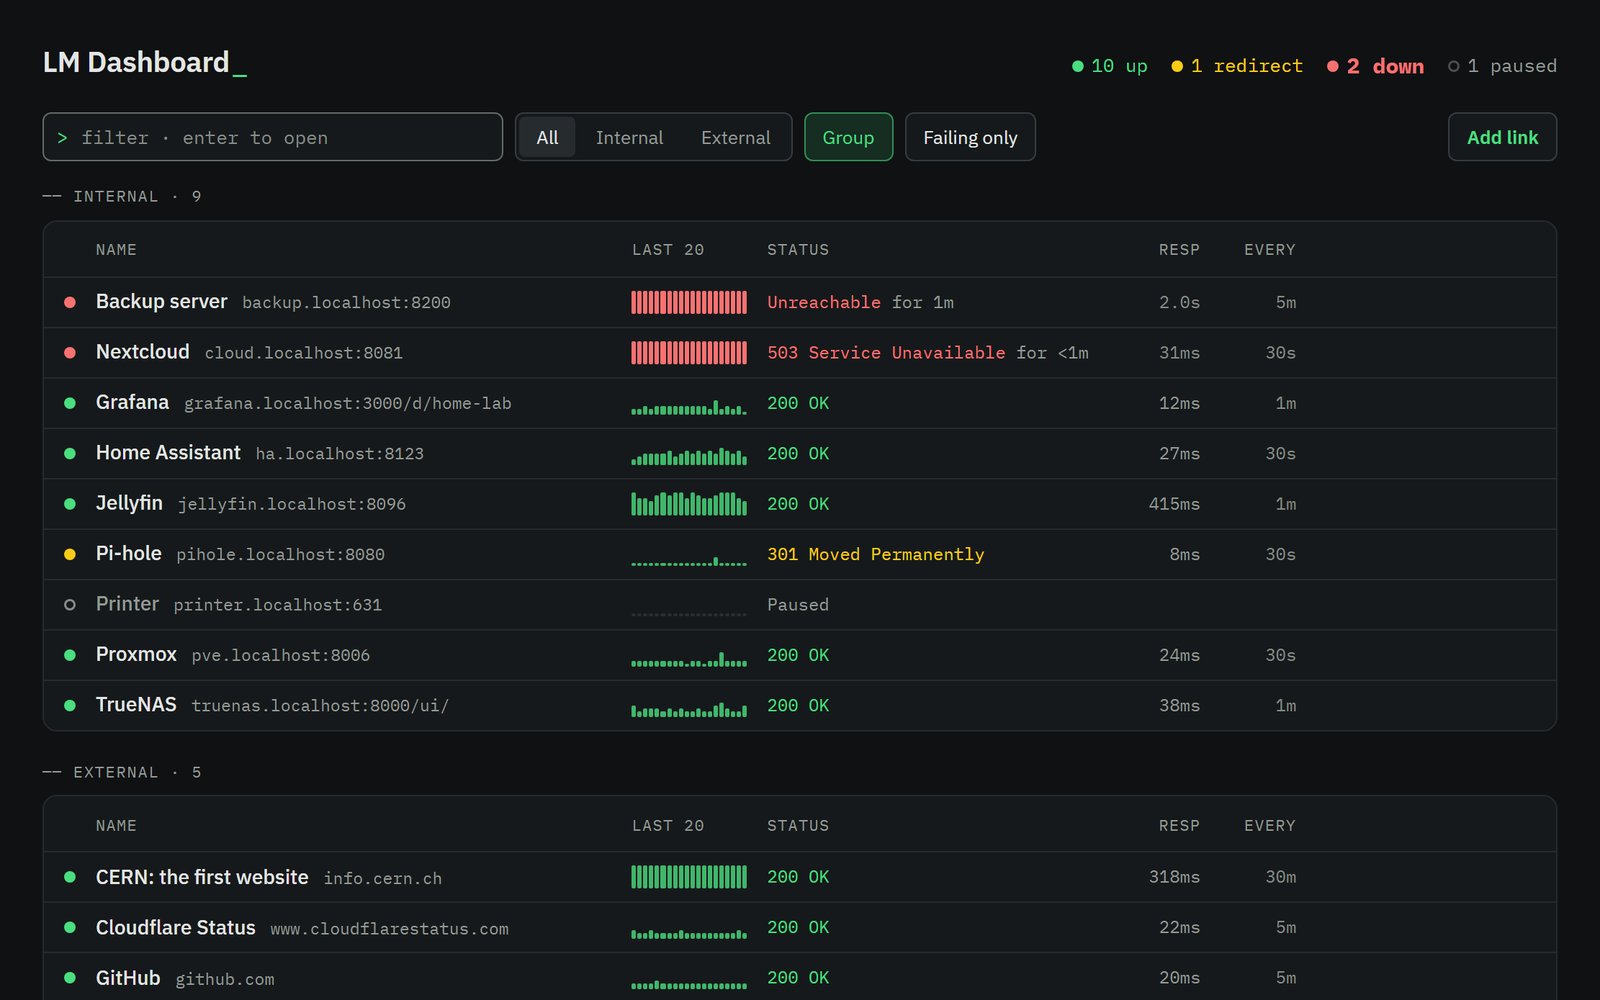
- Failing links sort to the top, with how long each has been down.
- A graph of the last 20 checks.
- The status code and response time. A 301 or 302 shows as a redirect.
- Failing only cuts the list to what needs attention.
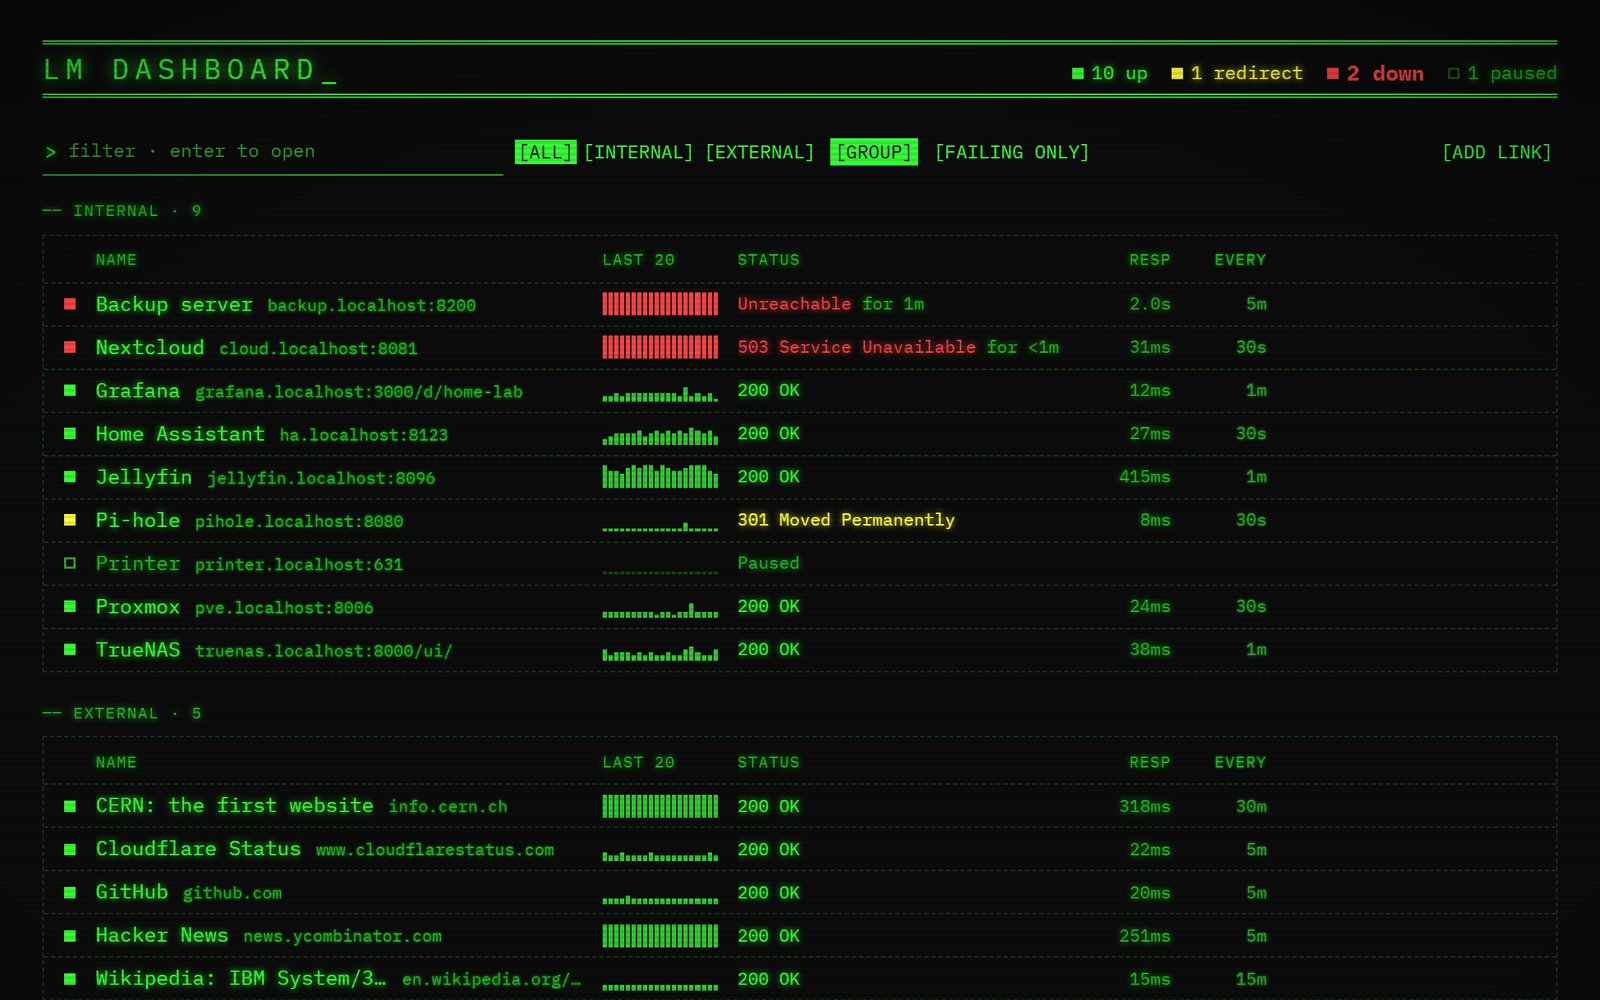
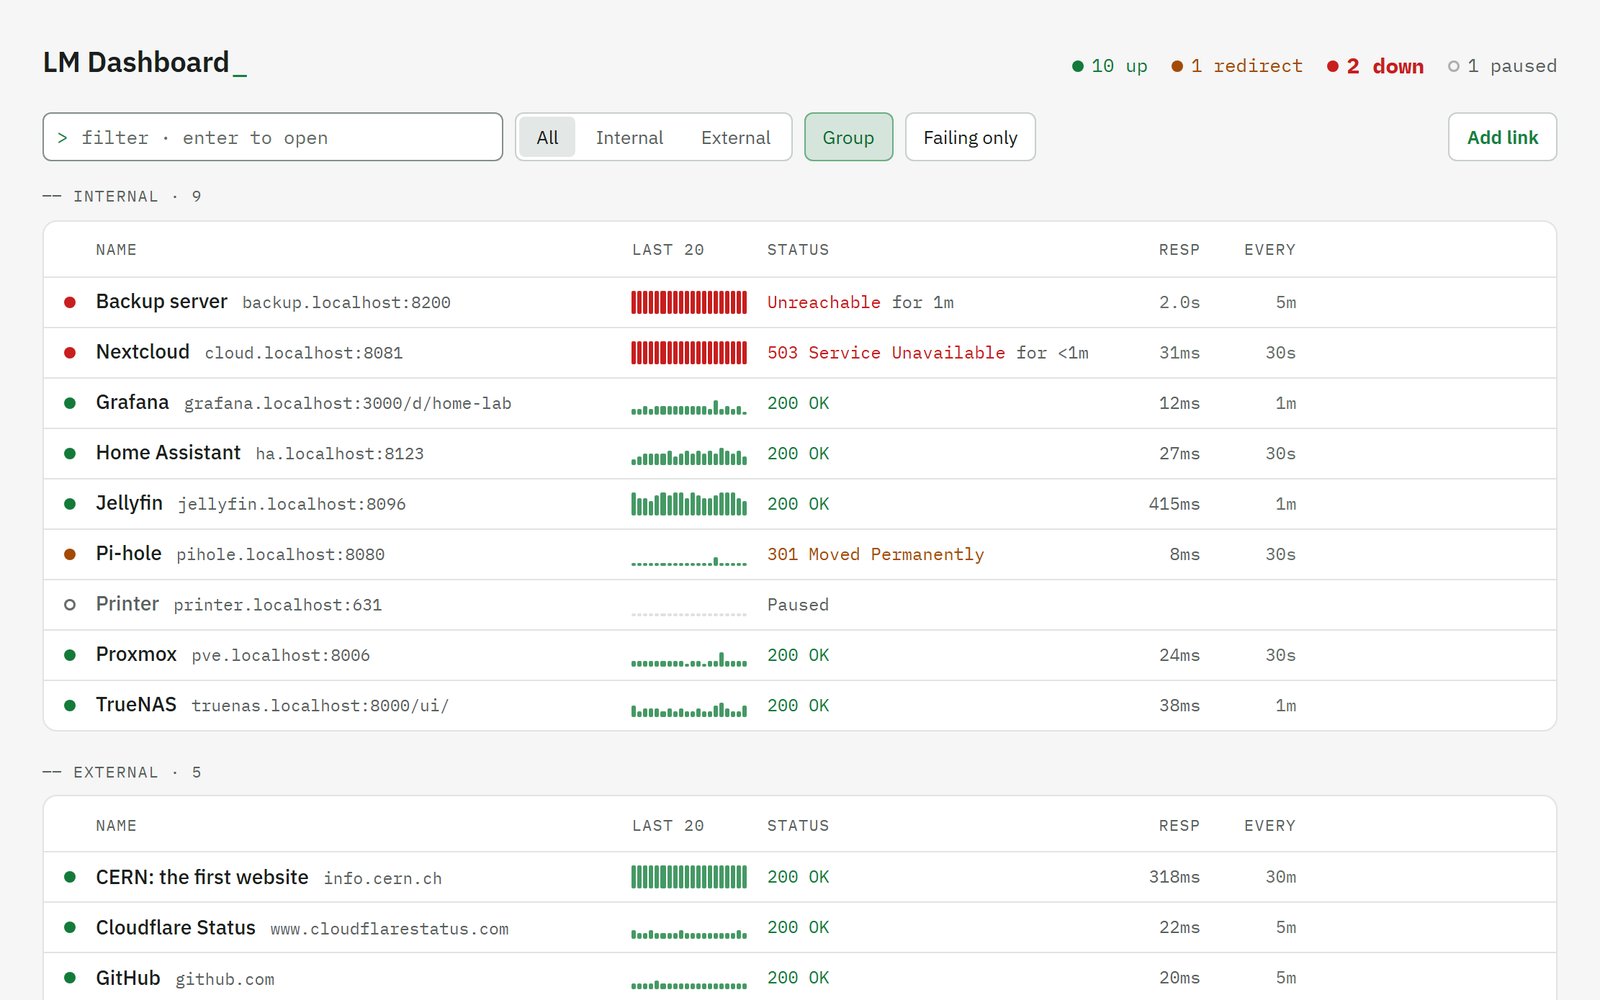
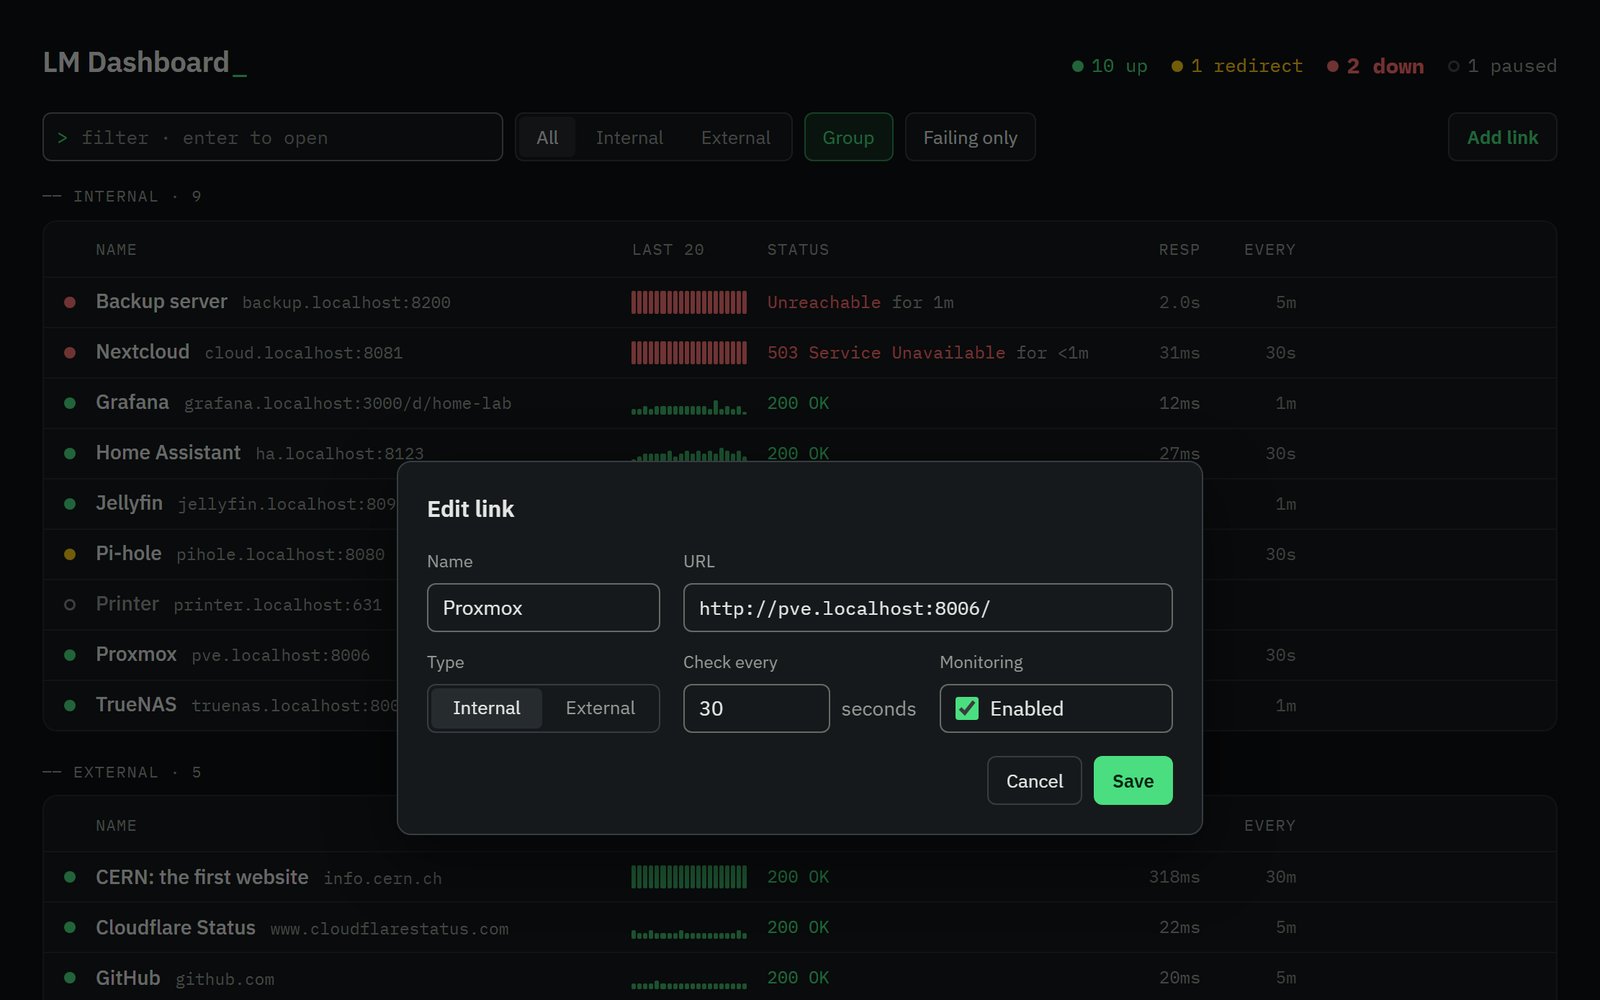
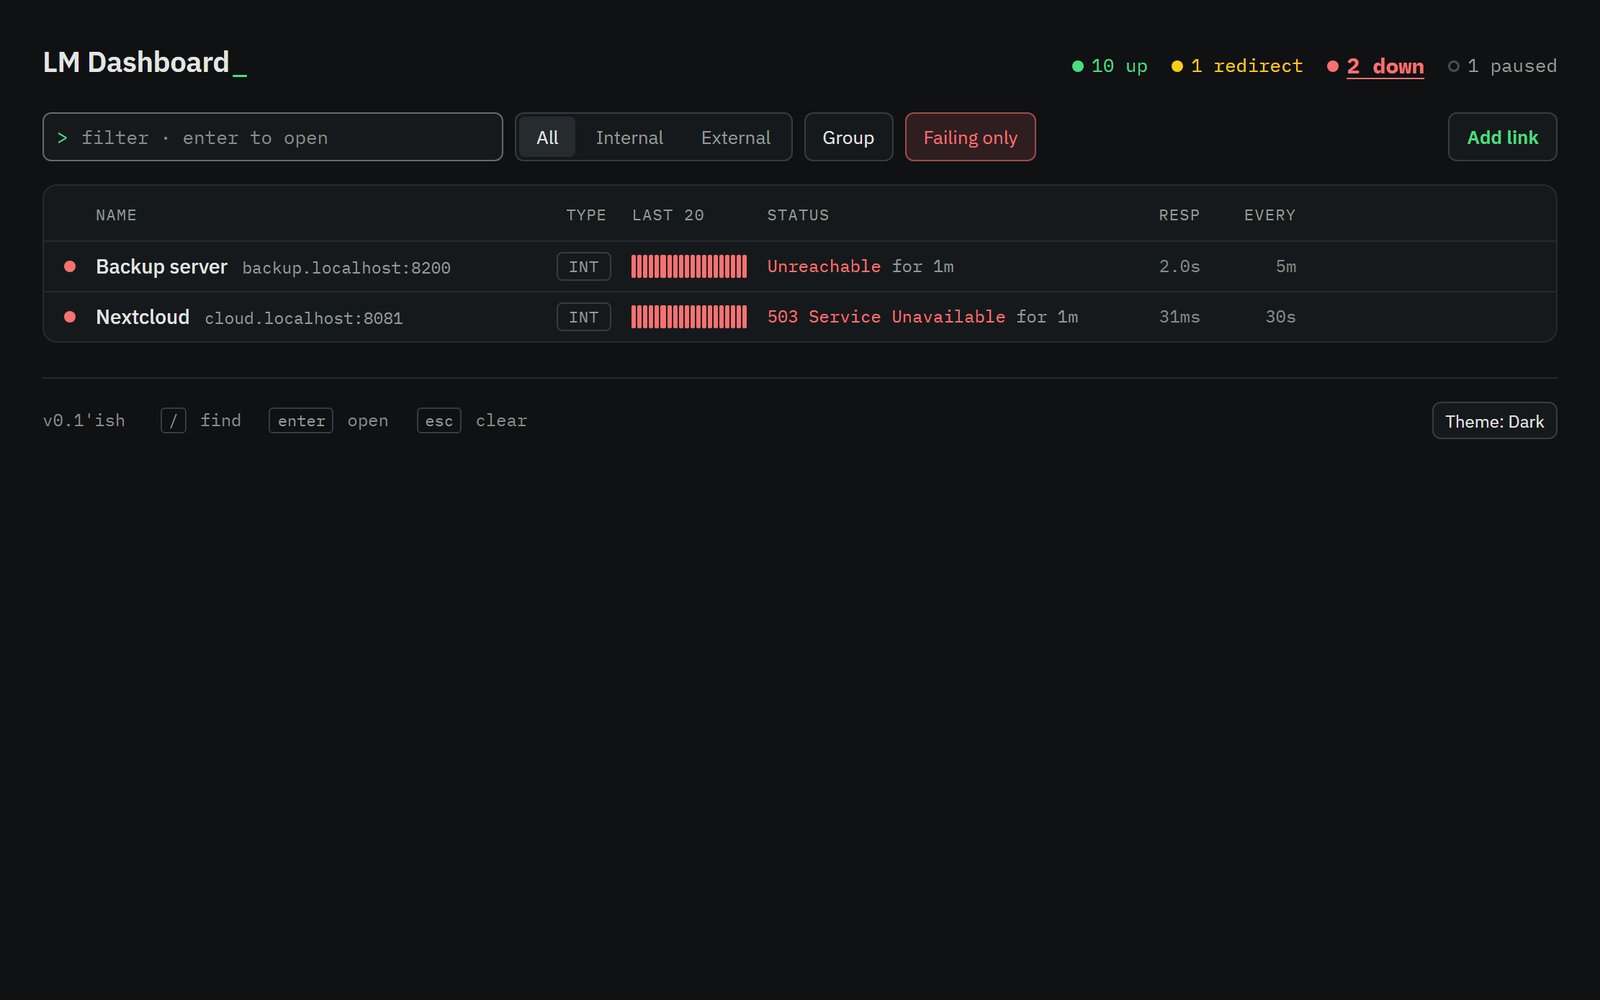
- Each link has its own check interval, down to one second. A row shows the status code, the response time and a graph of the last 20 checks. Failing links sort to the top with how long they've been down, and Failing only cuts the list to what needs attention.
- Redirects aren't followed, so a 301 or 302 shows as a redirect, not as the status of the page behind it. Internal links accept self-signed certificates; external links get full validation, so an expired certificate counts as a failure.
- Checks can land several times a second. The page batches them into one refresh every 250 ms, and each row carries a version number so Blazor re-renders only the rows that changed.
- It only answers requests addressed to host names and networks on an allowlist, which stops other websites from reaching it through DNS rebinding.
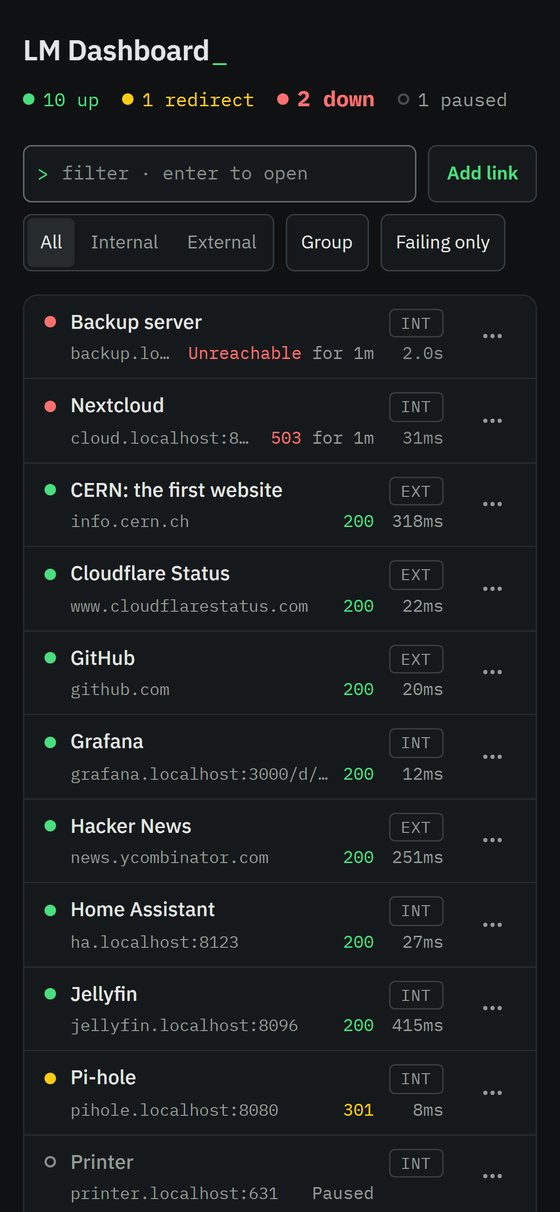
- Dark and light themes, plus a green-phosphor Classic theme with optional scanlines, a vignette and a brightness slider.
FamilyMatters
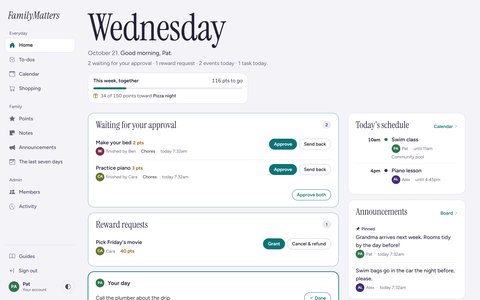
A shared home base for one family: calendar, to-dos, shopping lists, notes and announcements, plus chores that earn points the kids spend in a rewards store.
- Type
- Household app
- Runs
- Self-hosted
- For
- One family
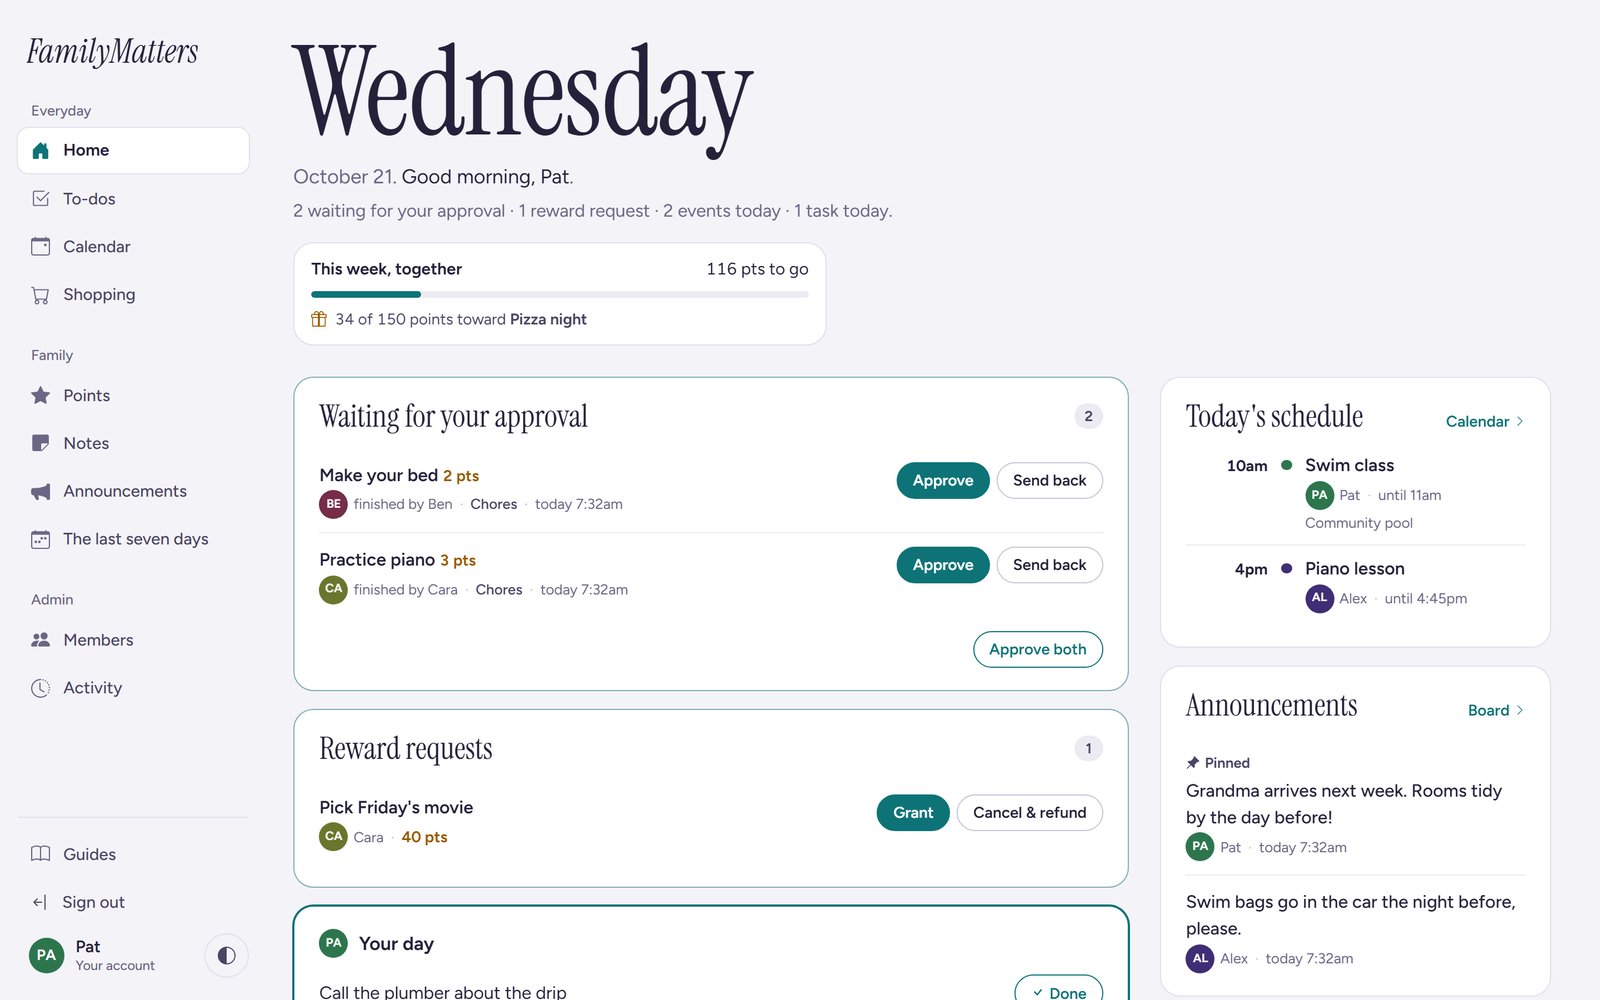
- Chores waiting for a parent's approval before any points are paid.
- Approve each finished chore, or send it back with a reason.
- Today's schedule, with who each event is for.
- The family announcements board, pinned notes first.
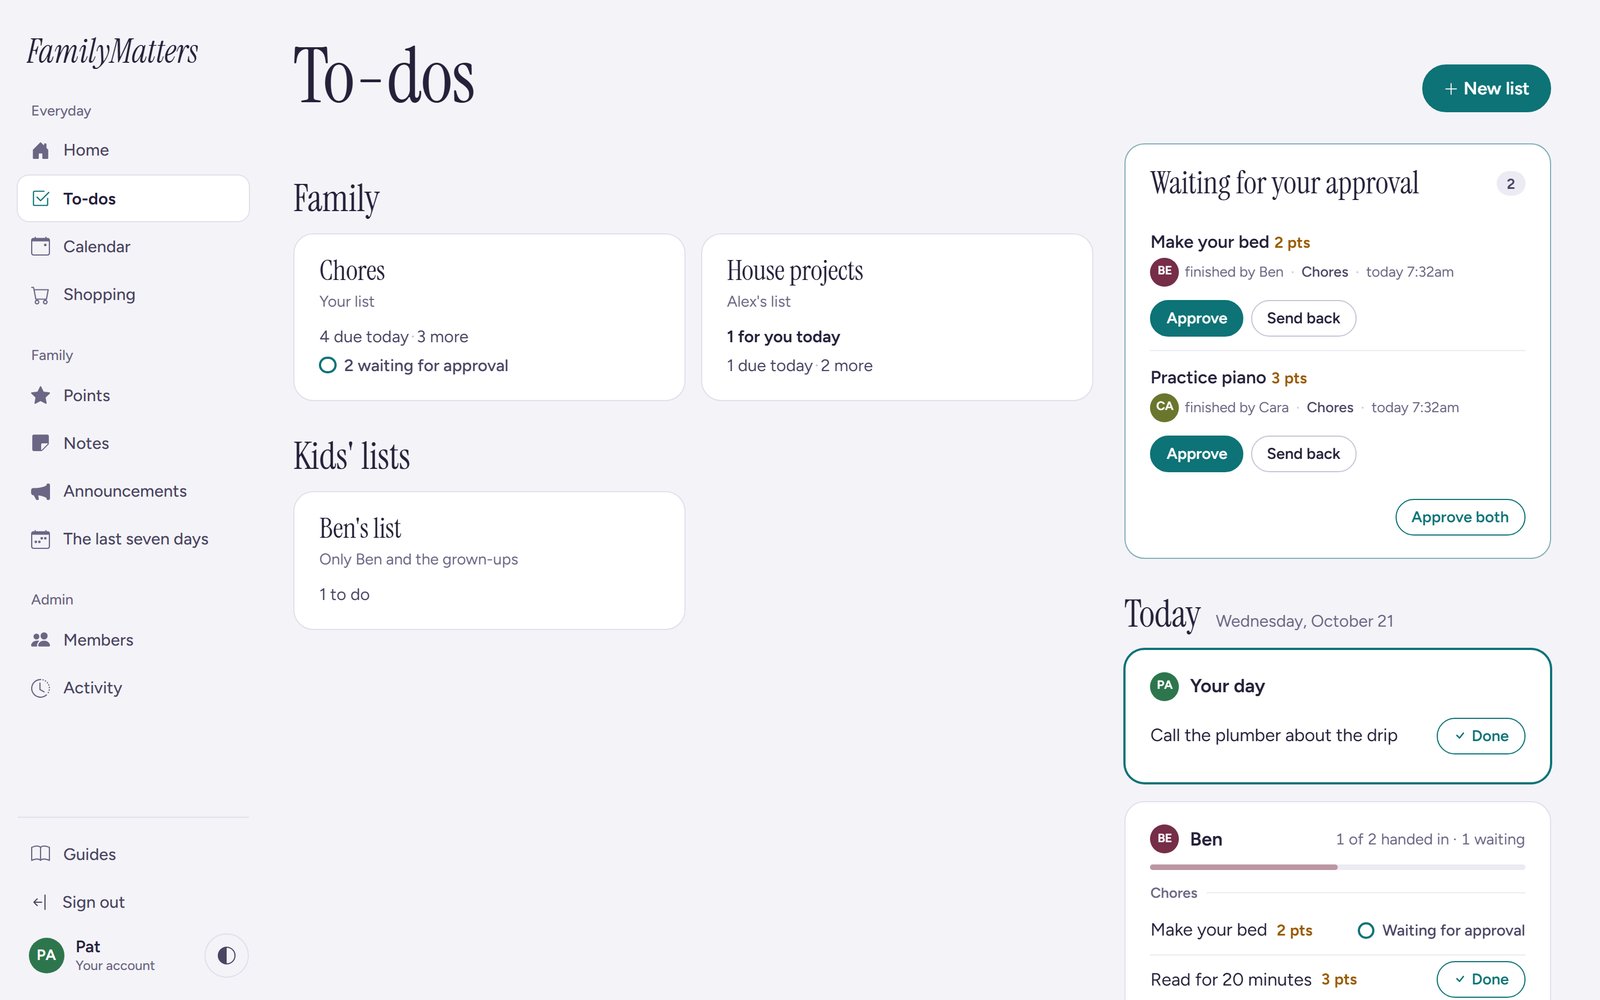
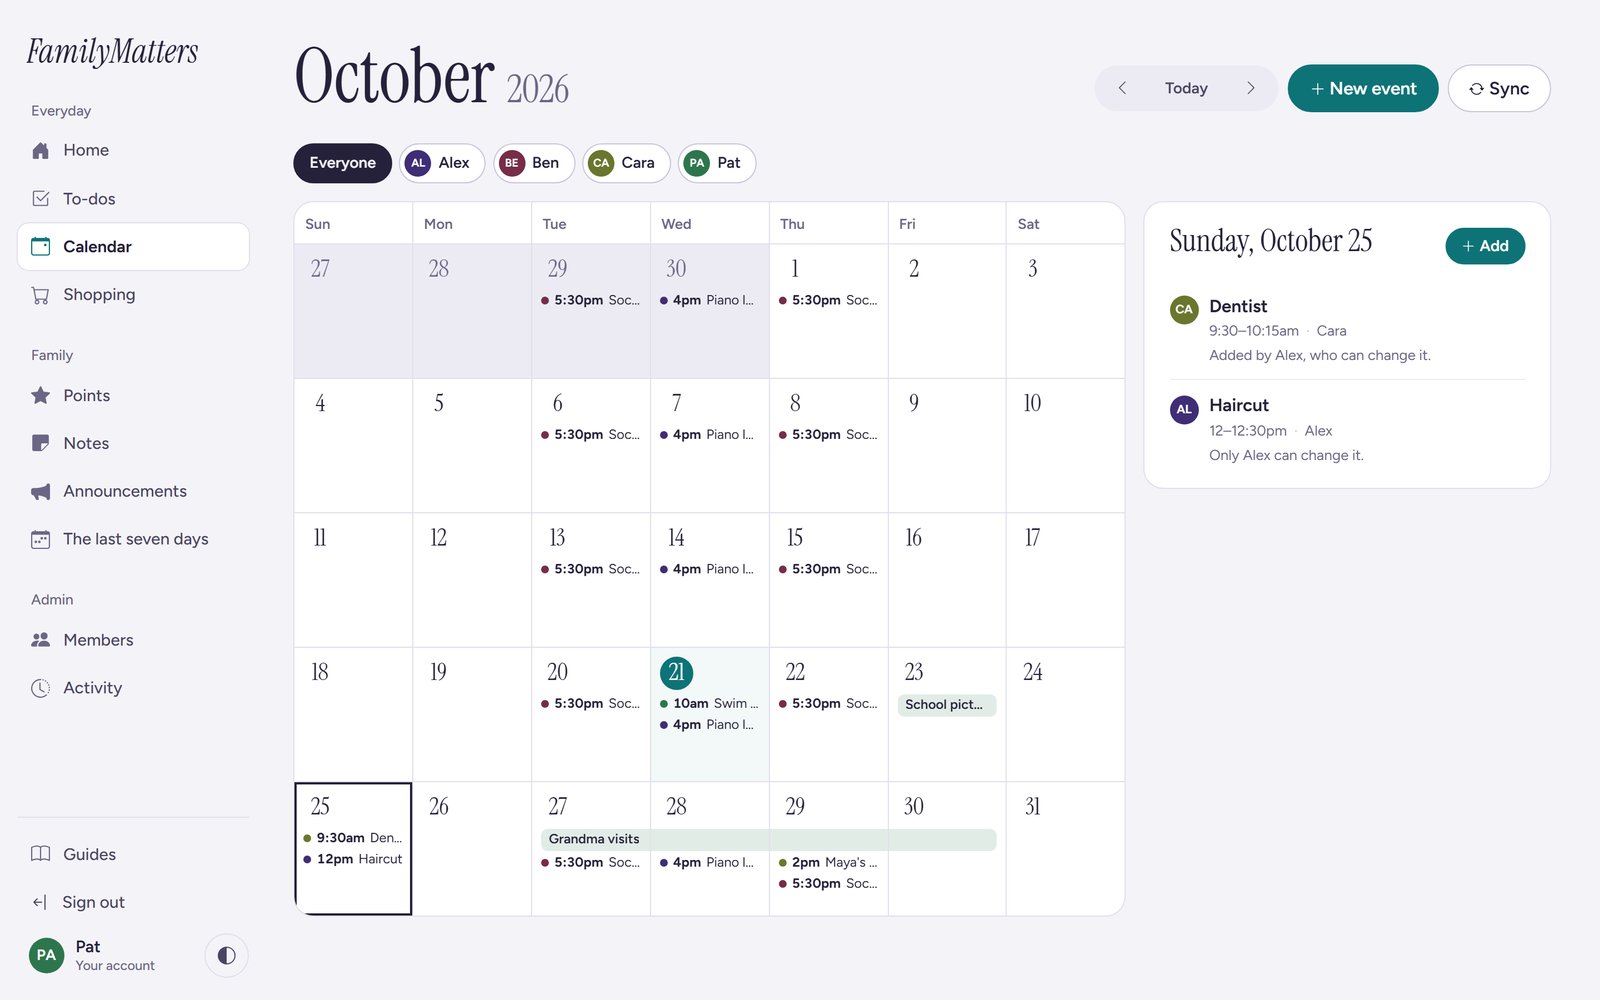
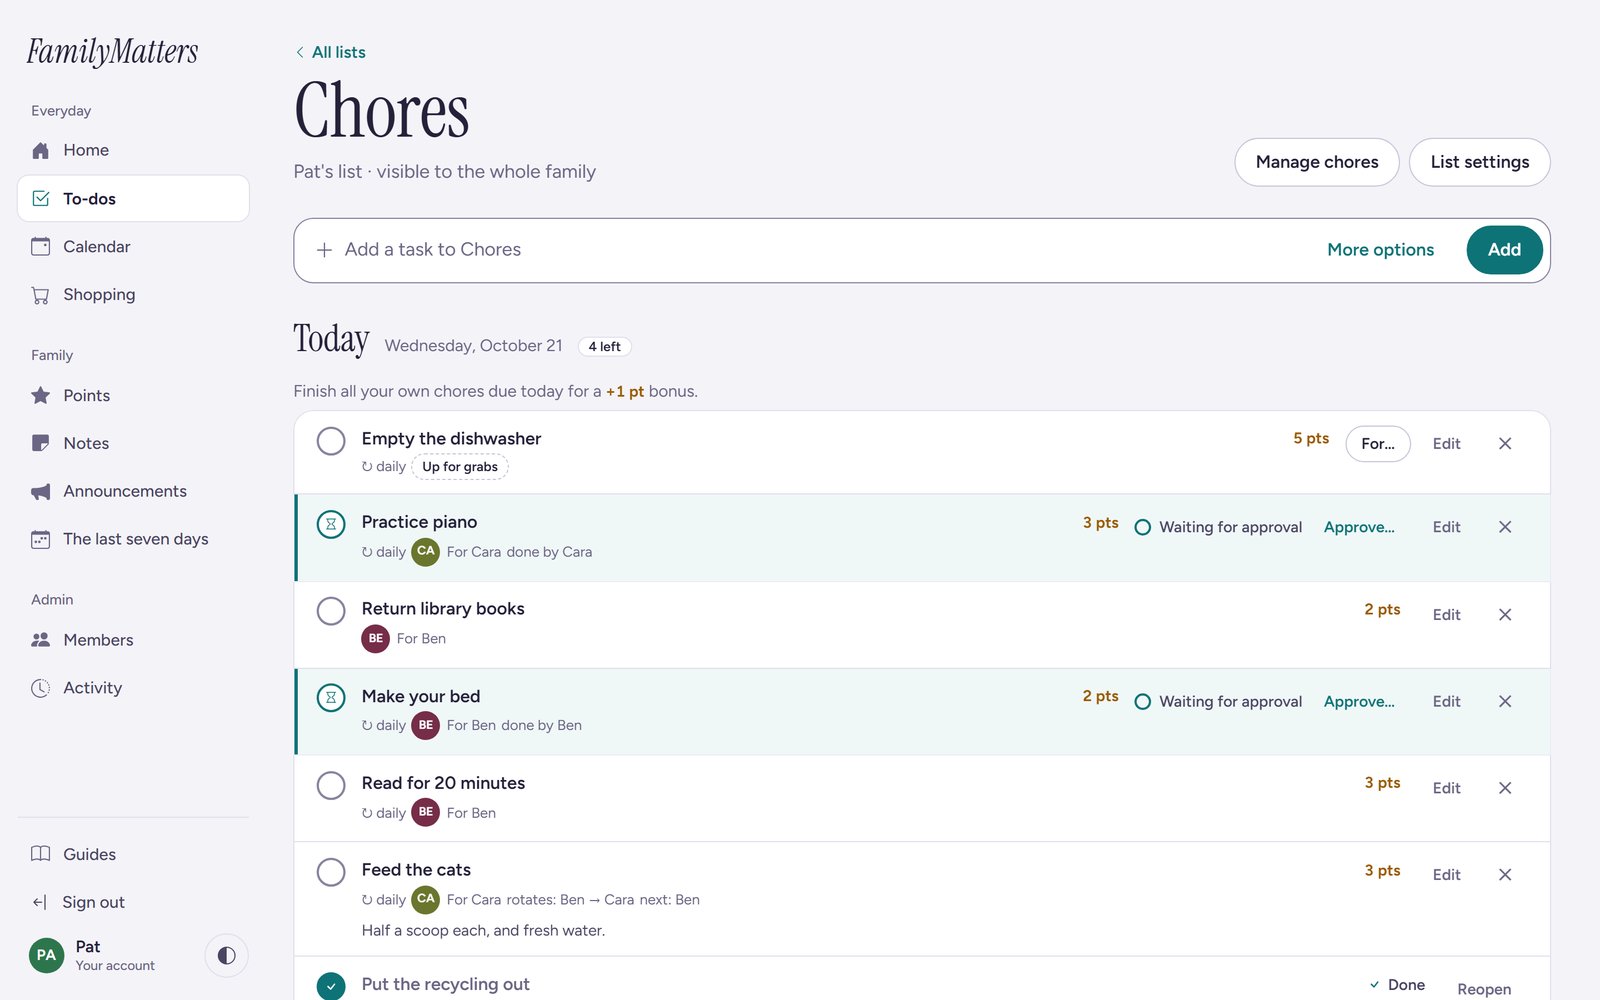
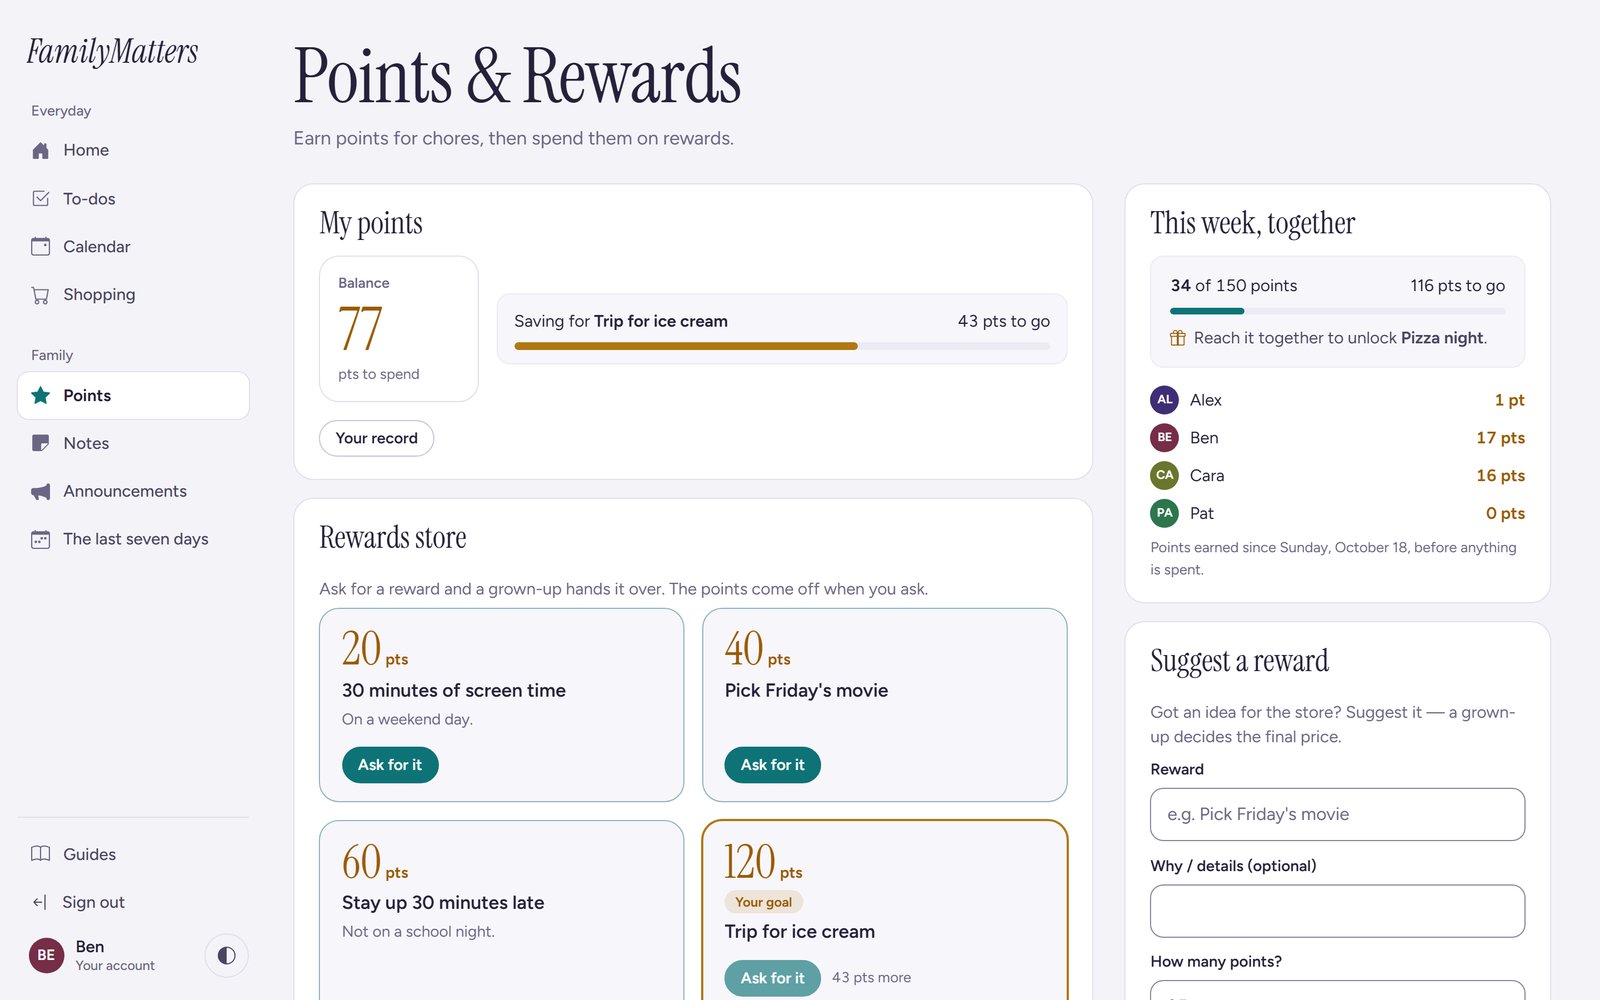
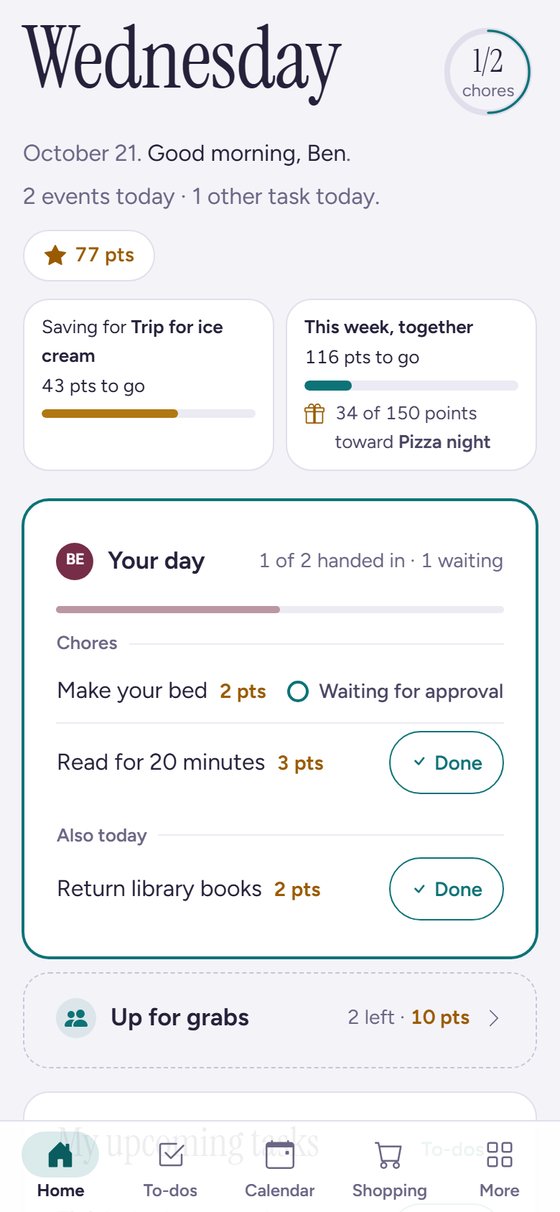
- Chores go to a parent for approval before any points are paid. Repeating chores can rotate between the kids, or be left up for grabs for whoever does them first.
- Kids can save toward a reward and suggest new ones. The family shares one weekly goal, and nobody is ranked against anyone else.
- A daily digest email, plus a weekly recap sent on Sunday evening. Outside calendars, such as school and sports teams, come in by subscription.
- Parents and admins sign in with an authenticator app. The app is on the public internet, so it enforces its own rate limits, security headers and session checks.
- Light and dark themes, and a bottom tab bar on a phone.
NoteScreenshots show example data only: a made-up family and its events.
CaddyMonWeb
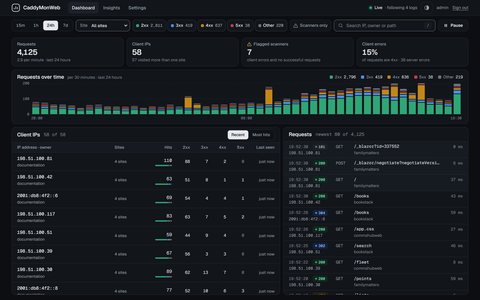
A live view of the traffic hitting every site on my server, in the browser. It's the web version of CaddyMon, so I can check on things from my phone.
- Type
- Server monitoring
- Runs
- Self-hosted, private
- See also
- CaddyMon
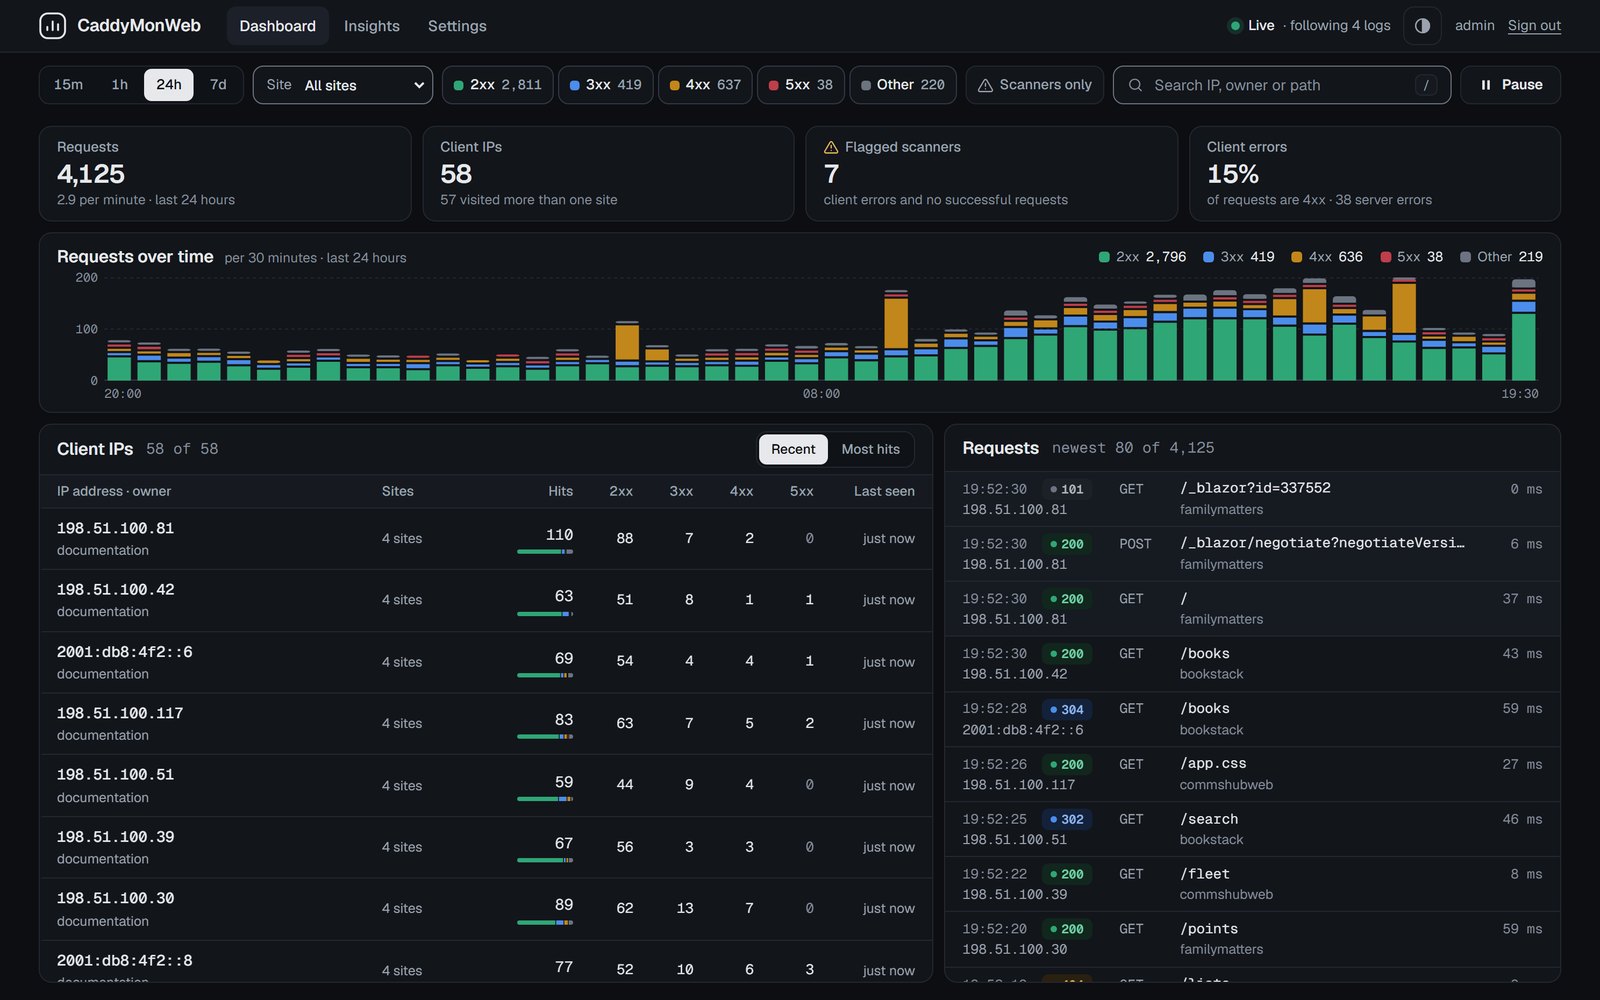
- Requests per half hour over the last day, by status class.
- Flagged scanners: addresses that got client errors and never a successful response.
- Requests grouped by client IP, with who owns each address.
- The newest requests, as they're written to the log.
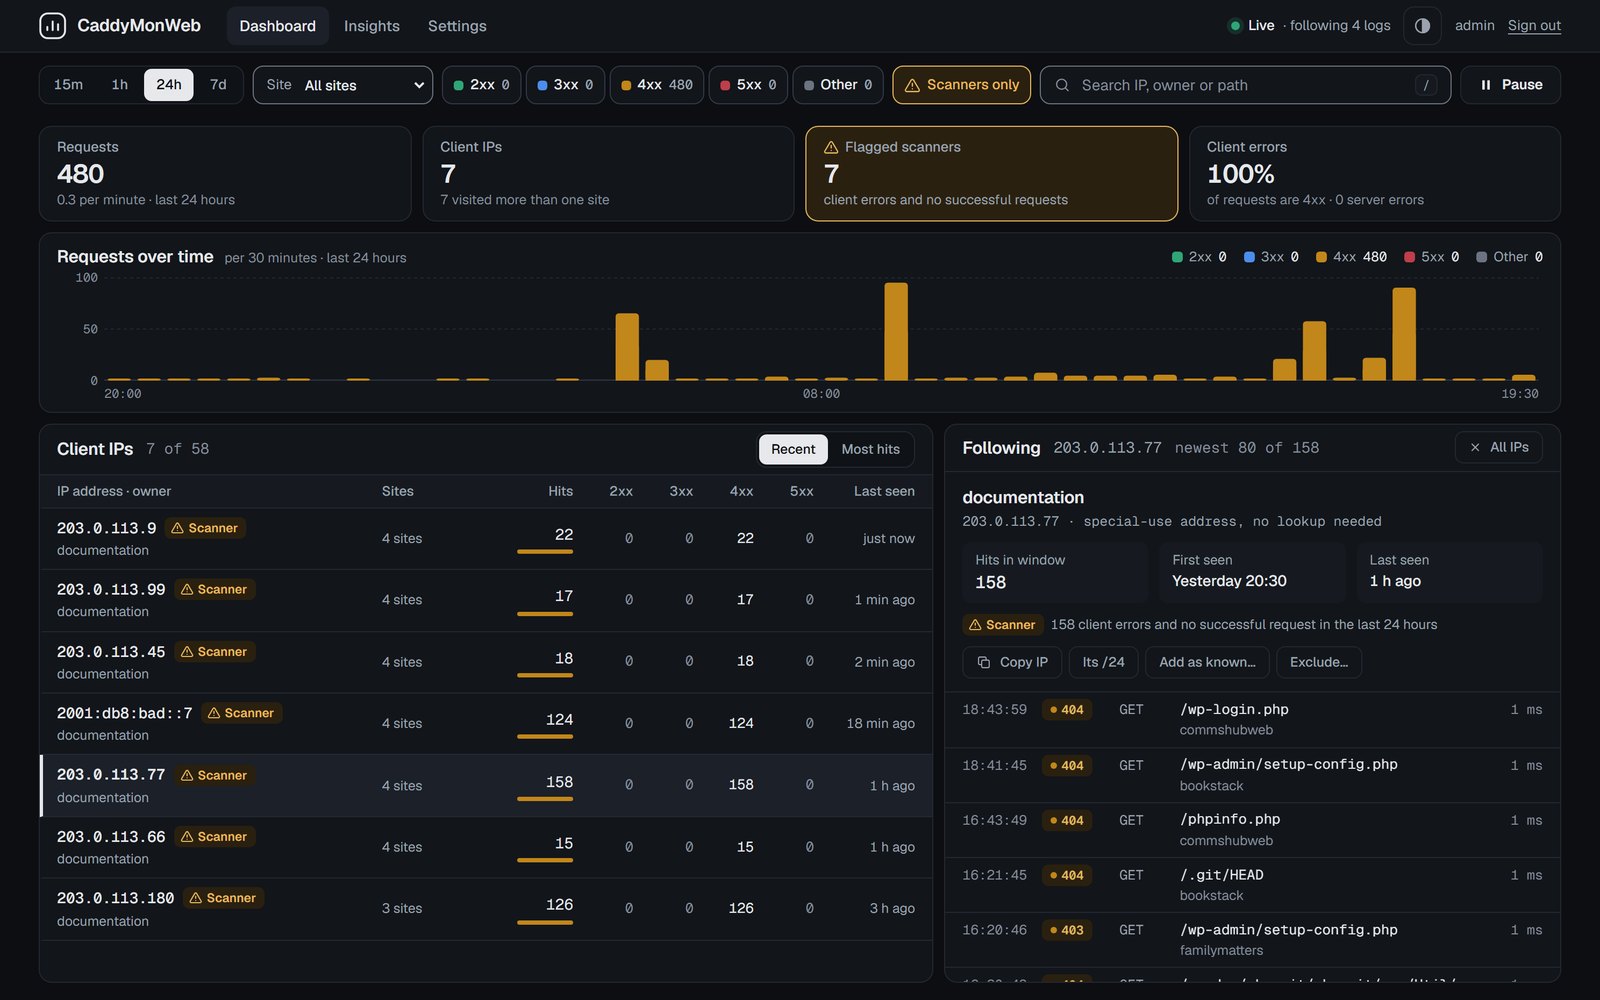
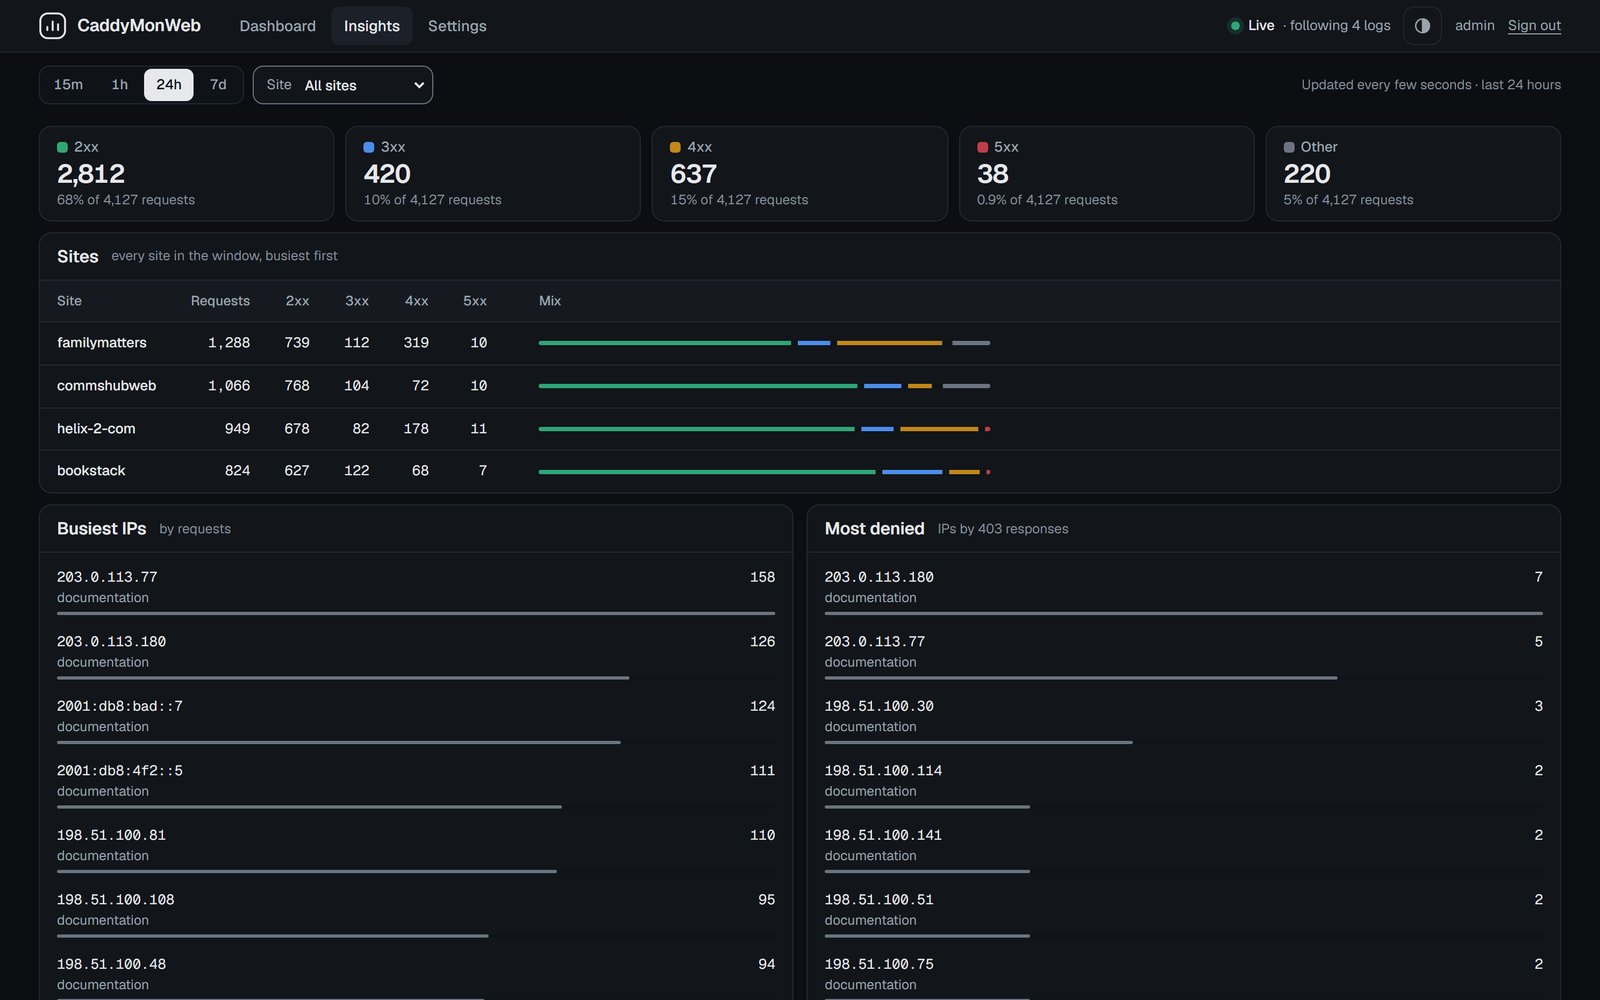
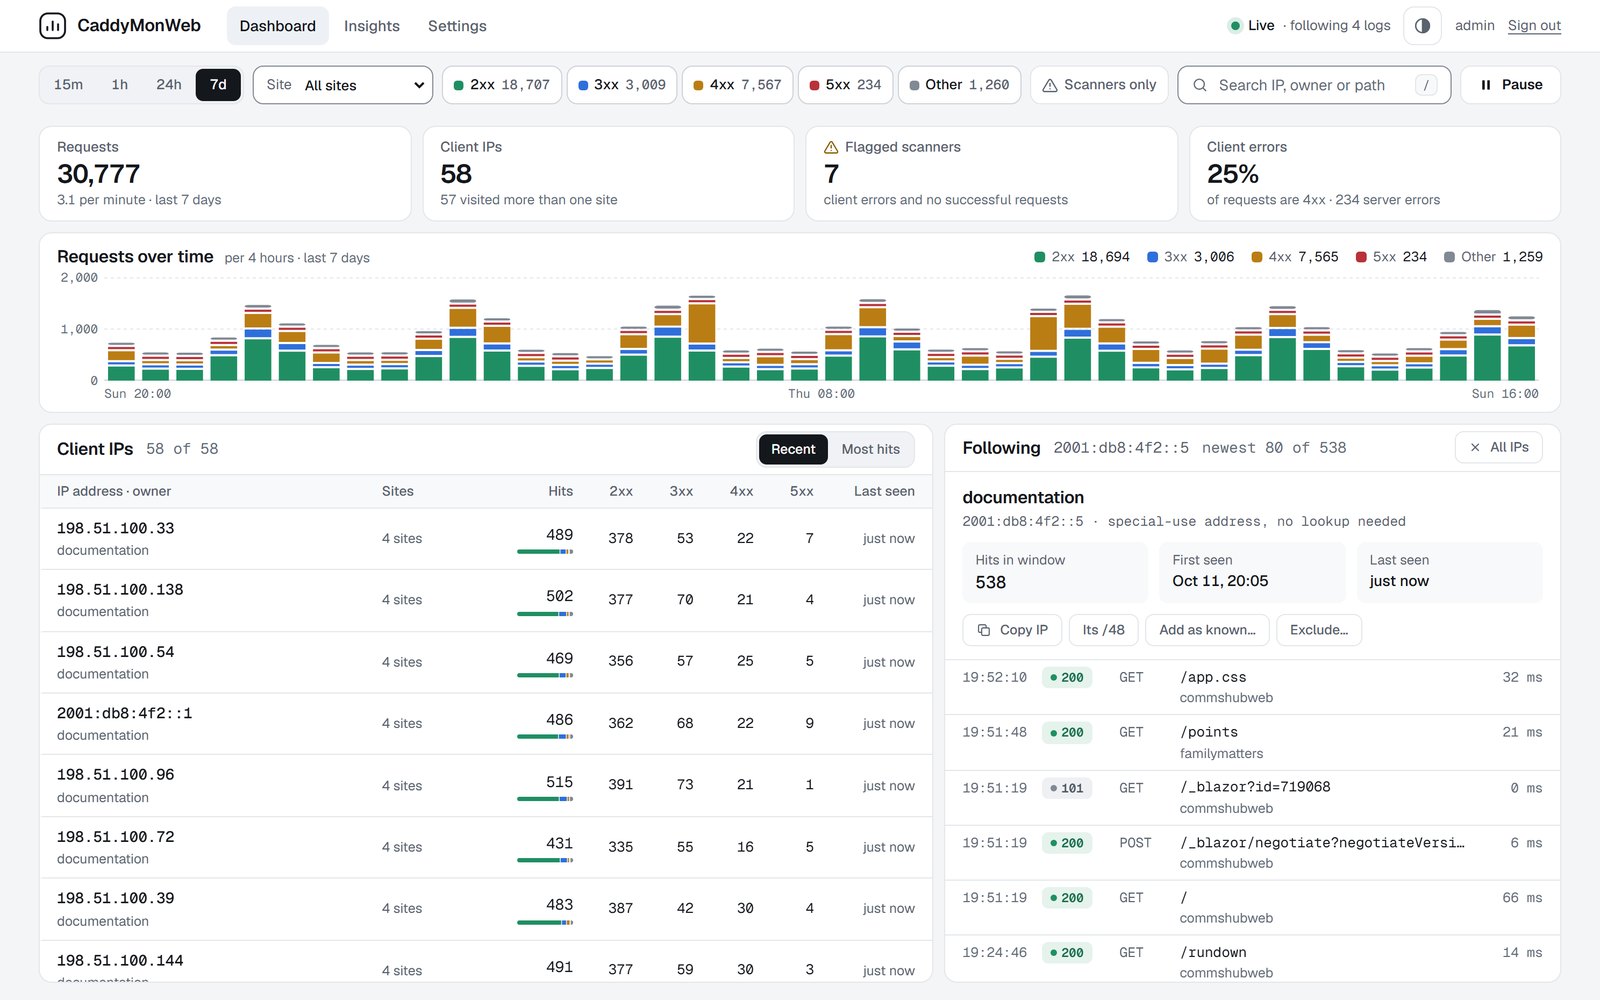
- It follows each site's Caddy access log as it's written, groups requests by client IP, shows who owns each address and flags the bots probing for /.env and wp-login.php.
- No database: the logs are the record. At startup it reads back a week of each log, including Caddy's rotated and gzipped copies, then picks up the live file exactly where that left off, so nothing is counted twice or missed.
- Switching between 15 minutes, an hour, a day and a week is instant. Each window keeps running totals that add a request when it arrives and subtract it when it ages out, and memory use has a fixed cap.
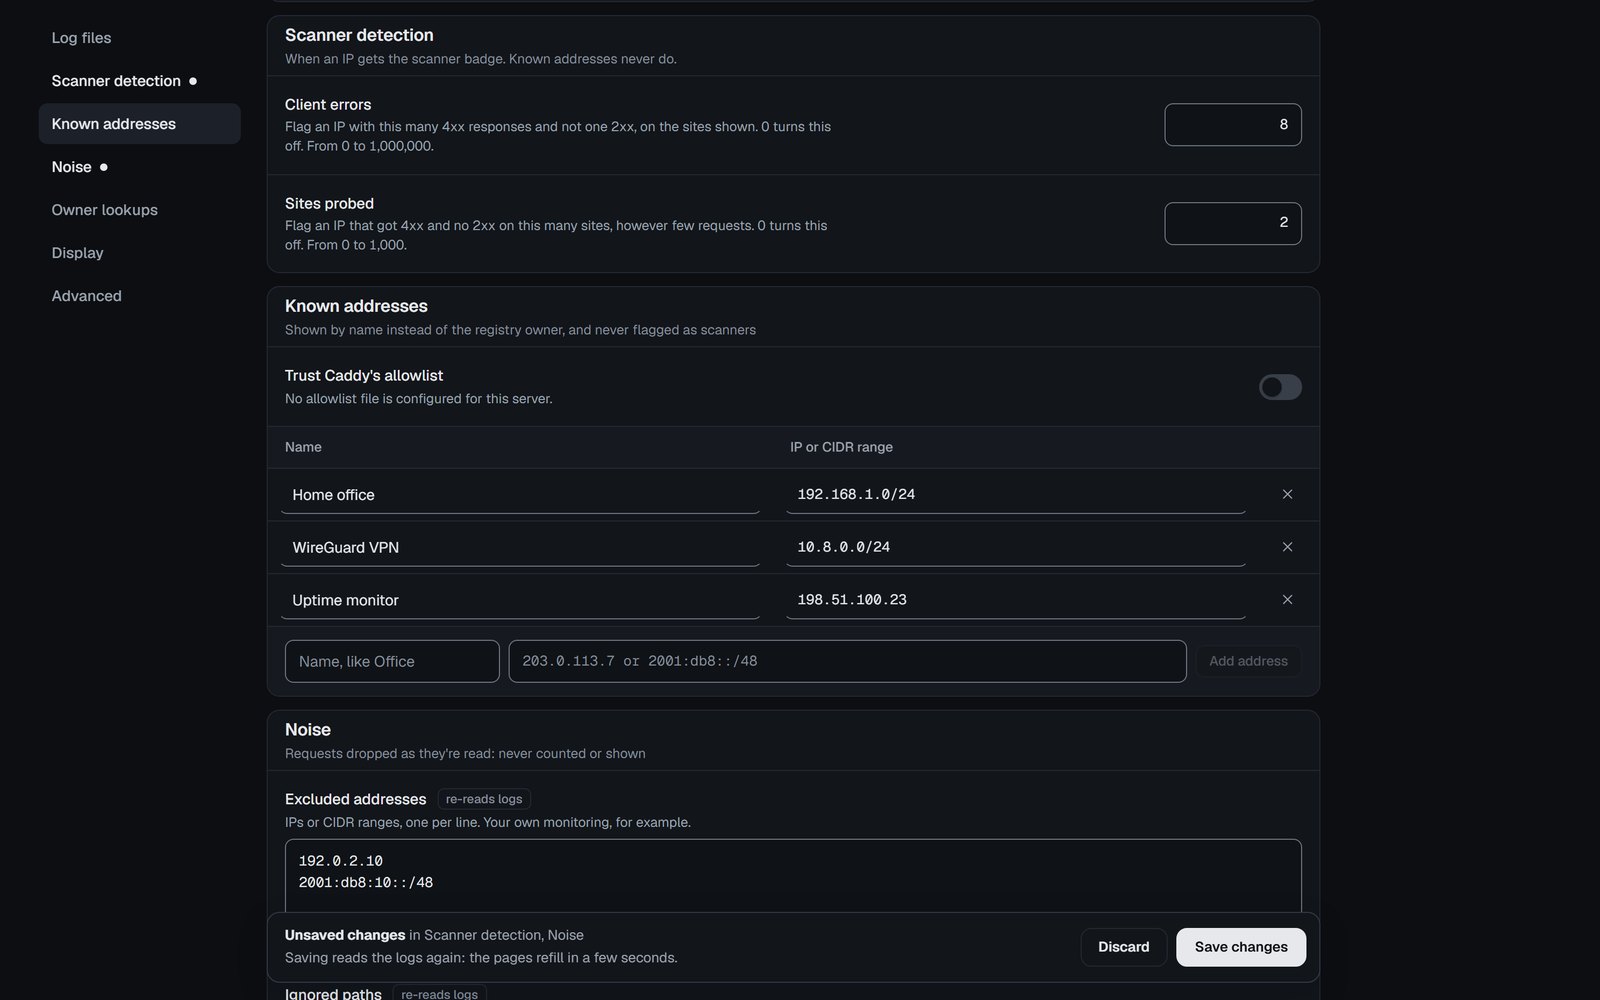
- An IP gets a scanner badge when it collects client errors and no successful responses, or probes several sites. Known addresses, like my own networks, are shown by name and never flagged.
- Owners come from the regional internet registries. Lookups only run for the rows on screen and stay within each registry's published rate limits. Only the address ranges are cached, never visitors' IPs.
- It's private: only reachable from approved networks, behind its own sign-in with an optional authenticator code, and a strict content security policy with no inline scripts or styles.
- Settings are edited as a draft, checked as you type, and the page says which changes mean reading the logs again. Light and dark themes, and it works on a phone.
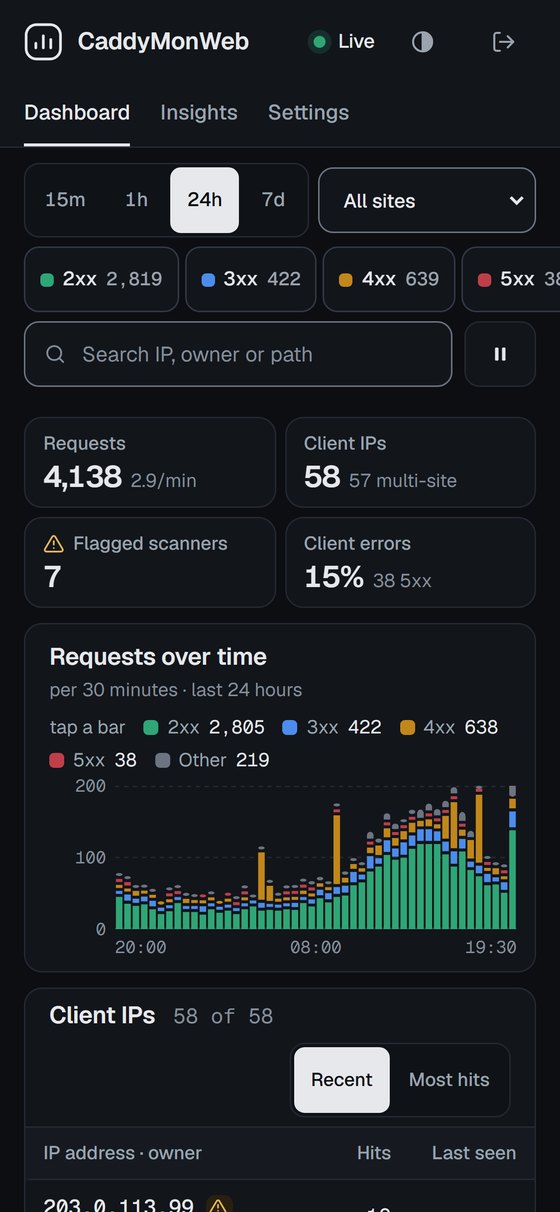
NoteScreenshots show generated traffic: documentation IP ranges and made-up requests.
Smaller projects
CaddyMon
A live, htop-style view of a Caddy web server's access log, in the terminal.
- Type
- Command-line tool
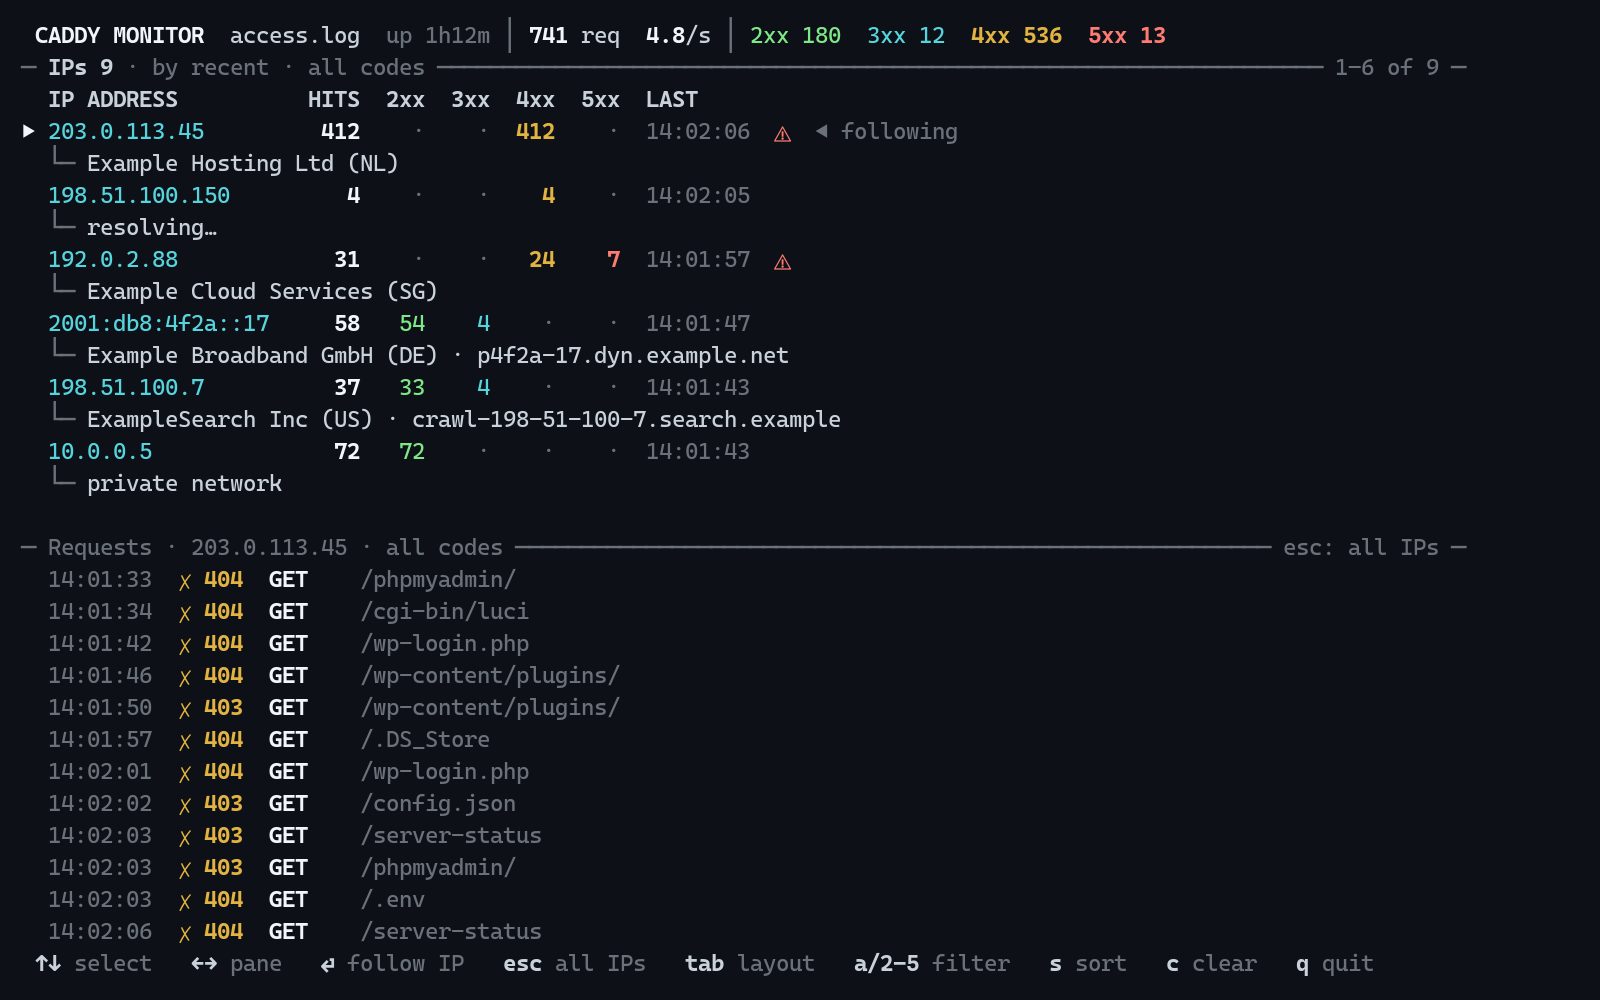
It groups requests by client IP, shows who owns each address and flags likely scanners, so one bot probing for /.env doesn't bury everything else. CaddyMonWeb is the web version of it.
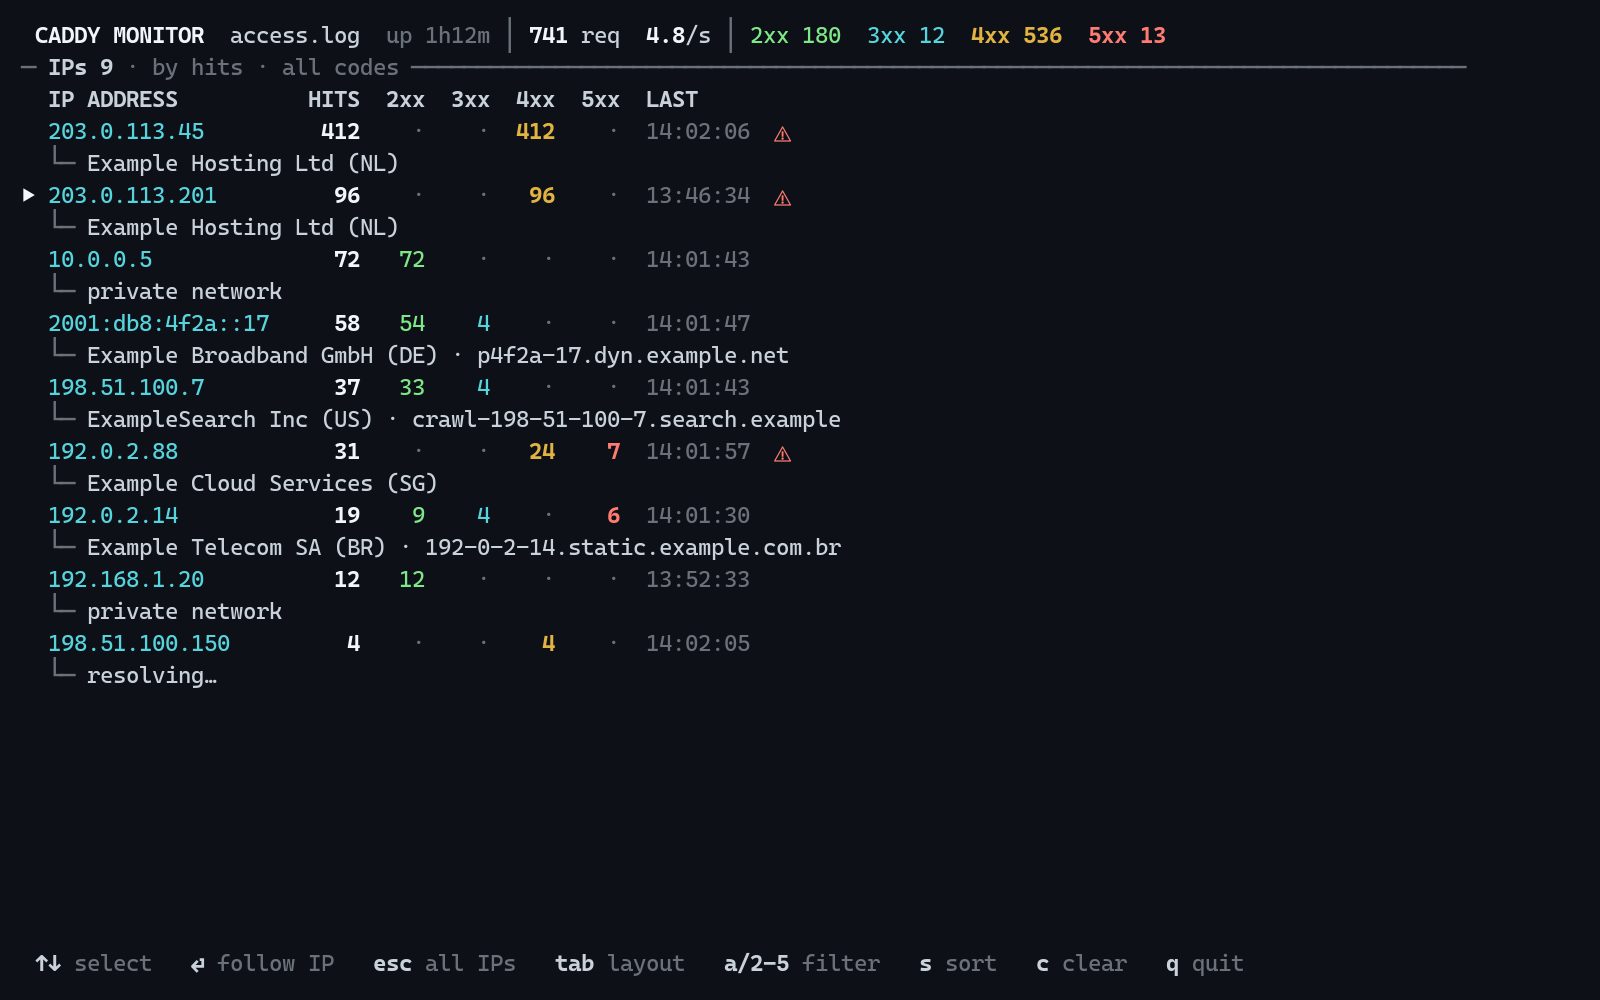
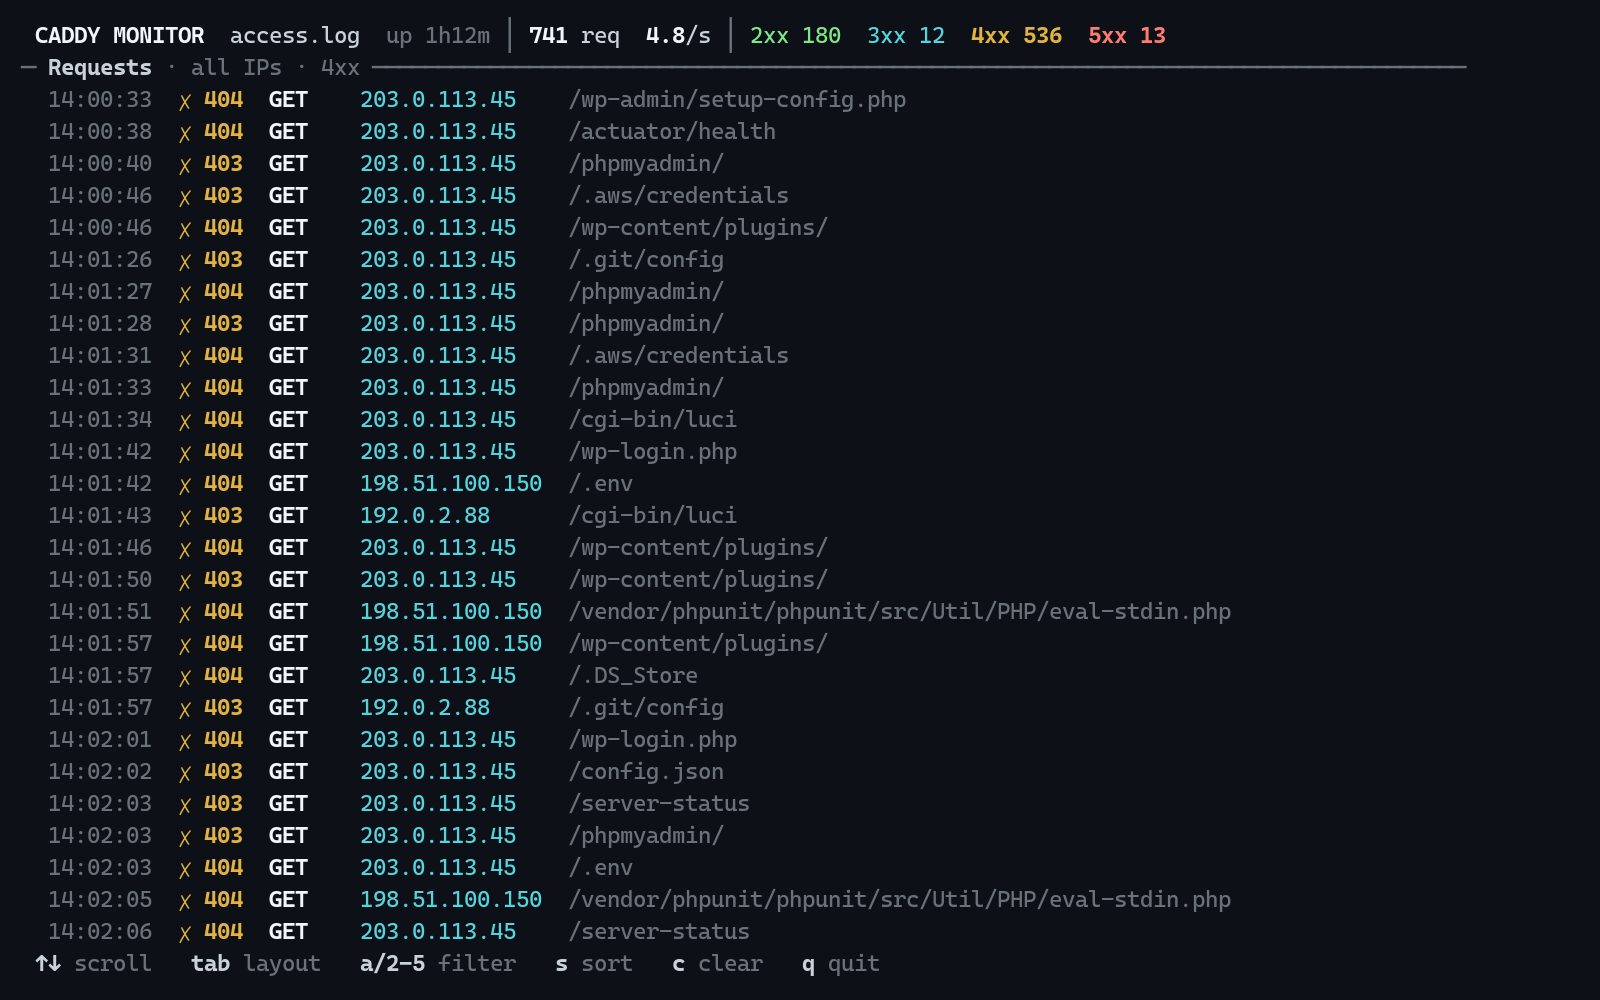
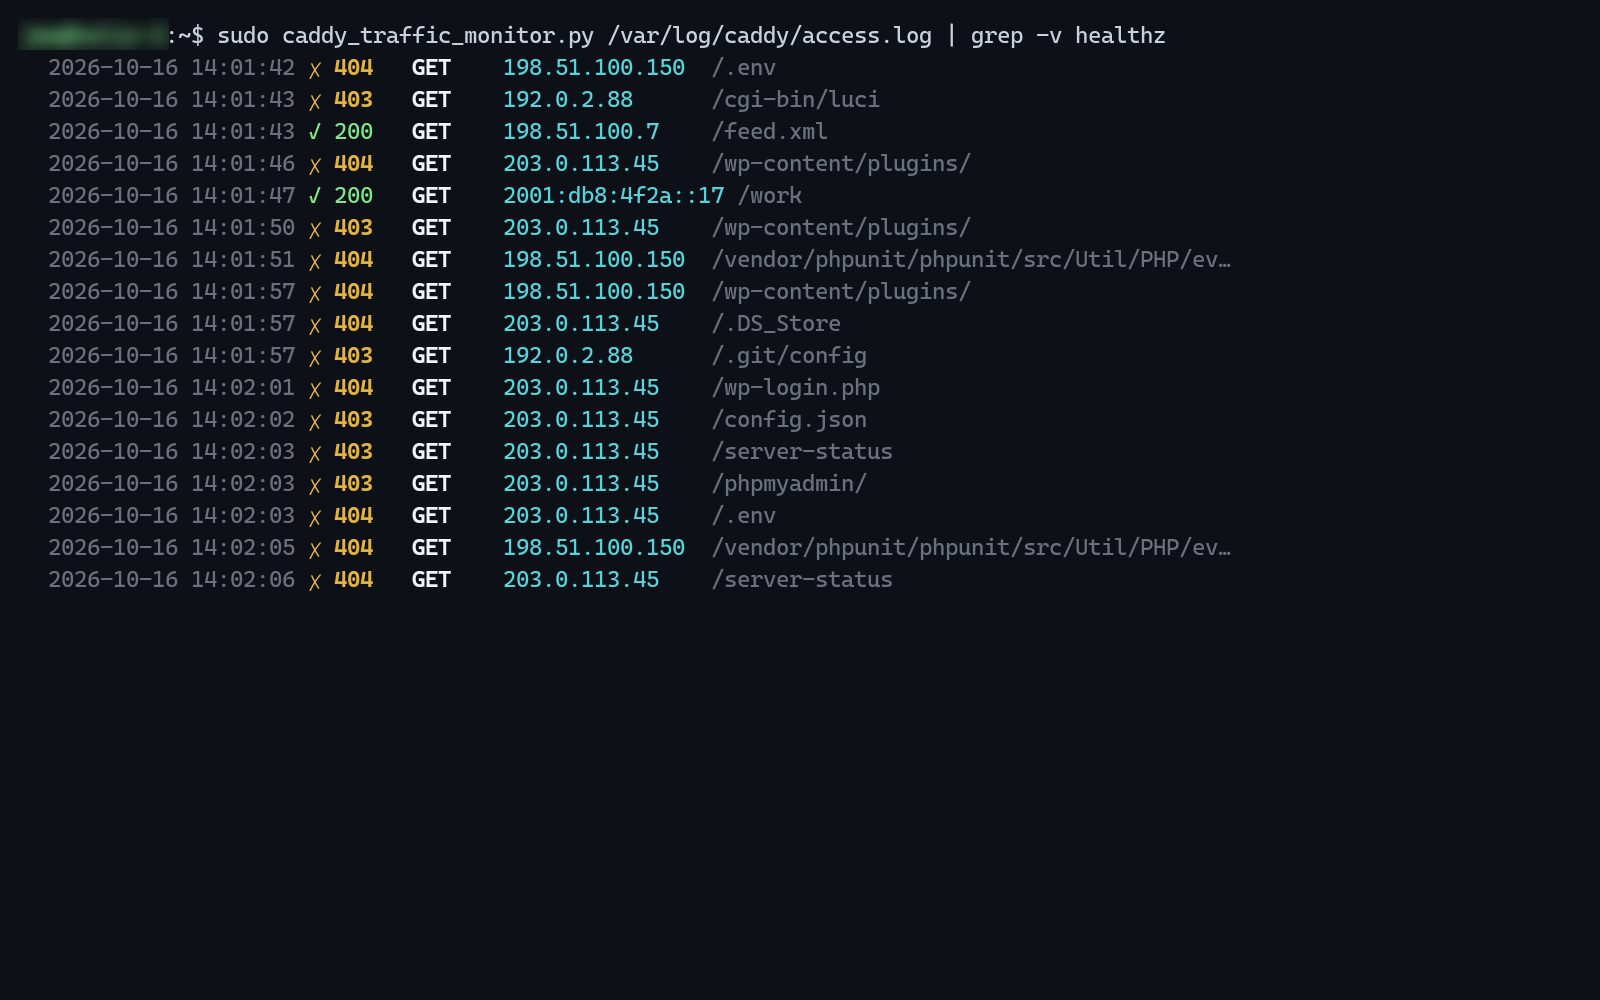
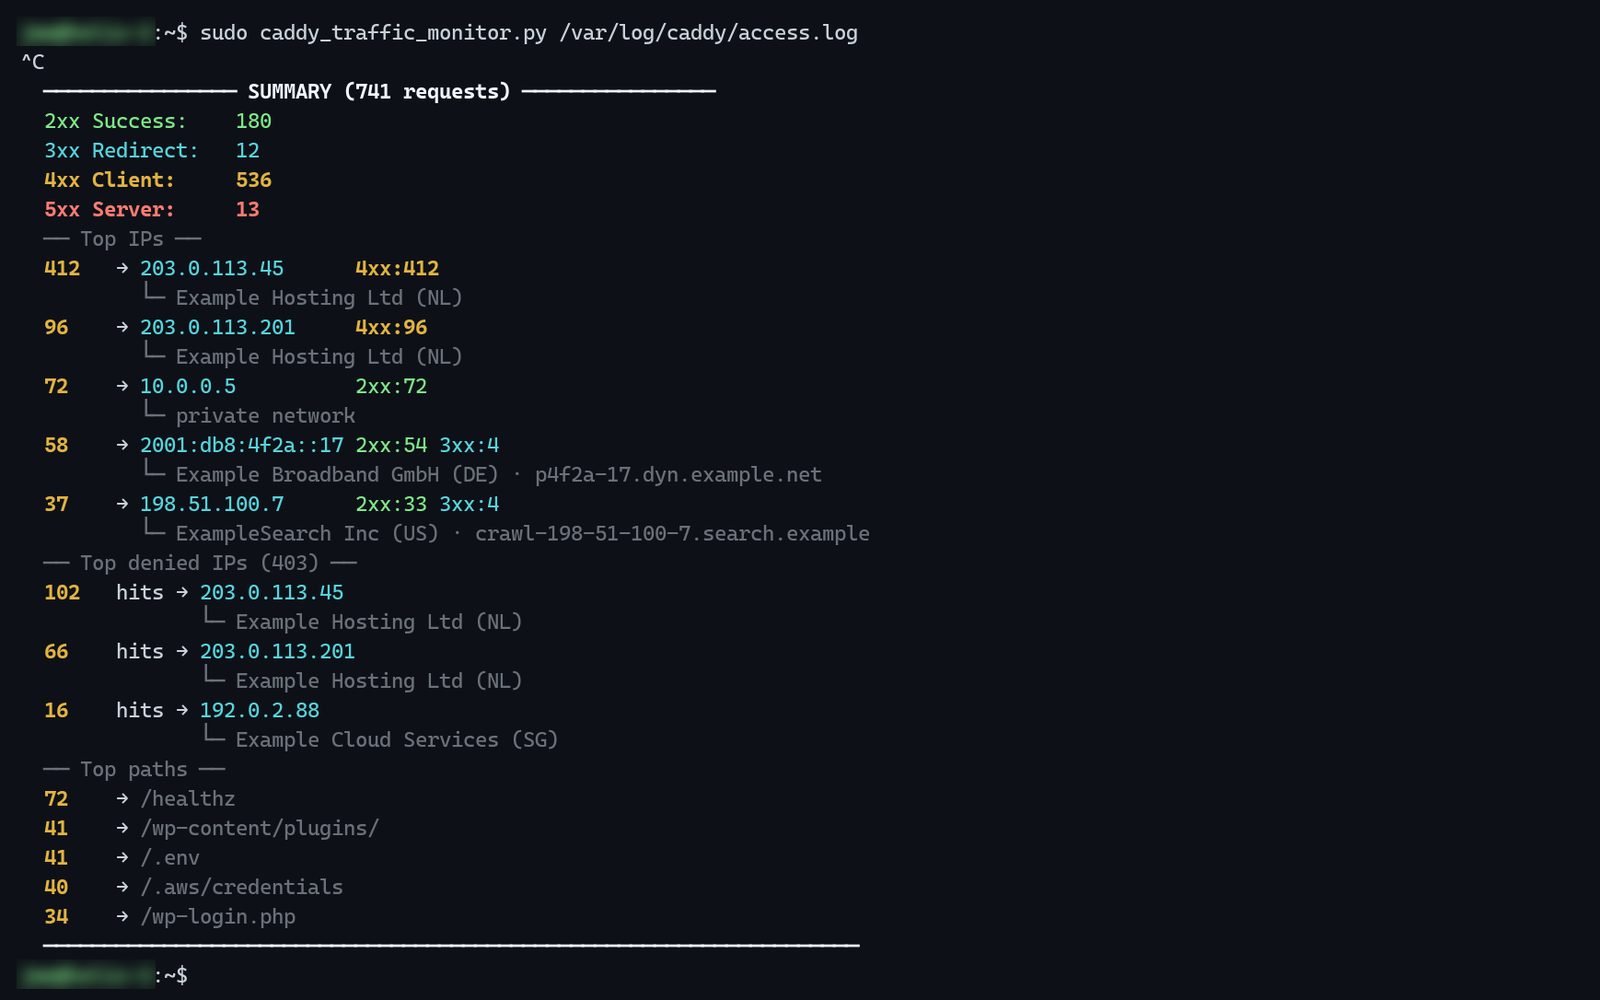
NoteExample data only: documentation IP ranges and made-up owners.
Page String Watcher
A free Edge extension that watches the tabs you already have open for words you pick, like "Available" on a sold-out ticket page.
- Type
- Browser extension
- Get it
- Microsoft Edge Add-ons
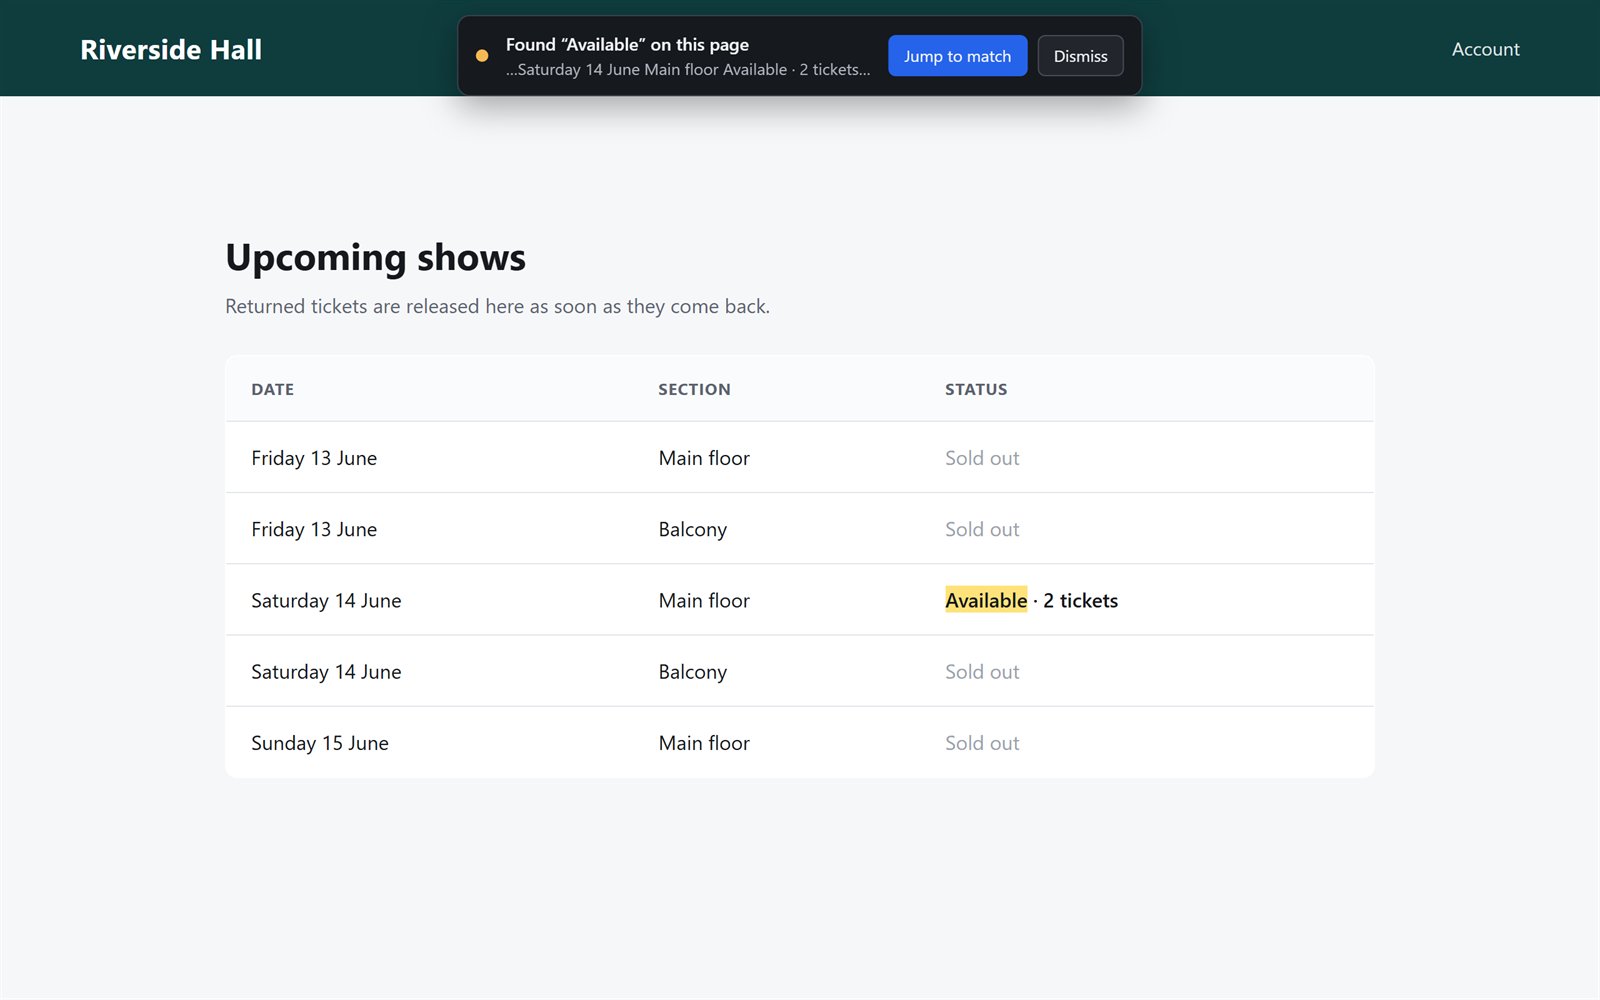
It checks again every time the page changes, so it also catches web apps that update without reloading. When a word turns up, you get a desktop notification, a banner on the page, a flashing tab title and a highlight on the match. It makes no network requests of its own.
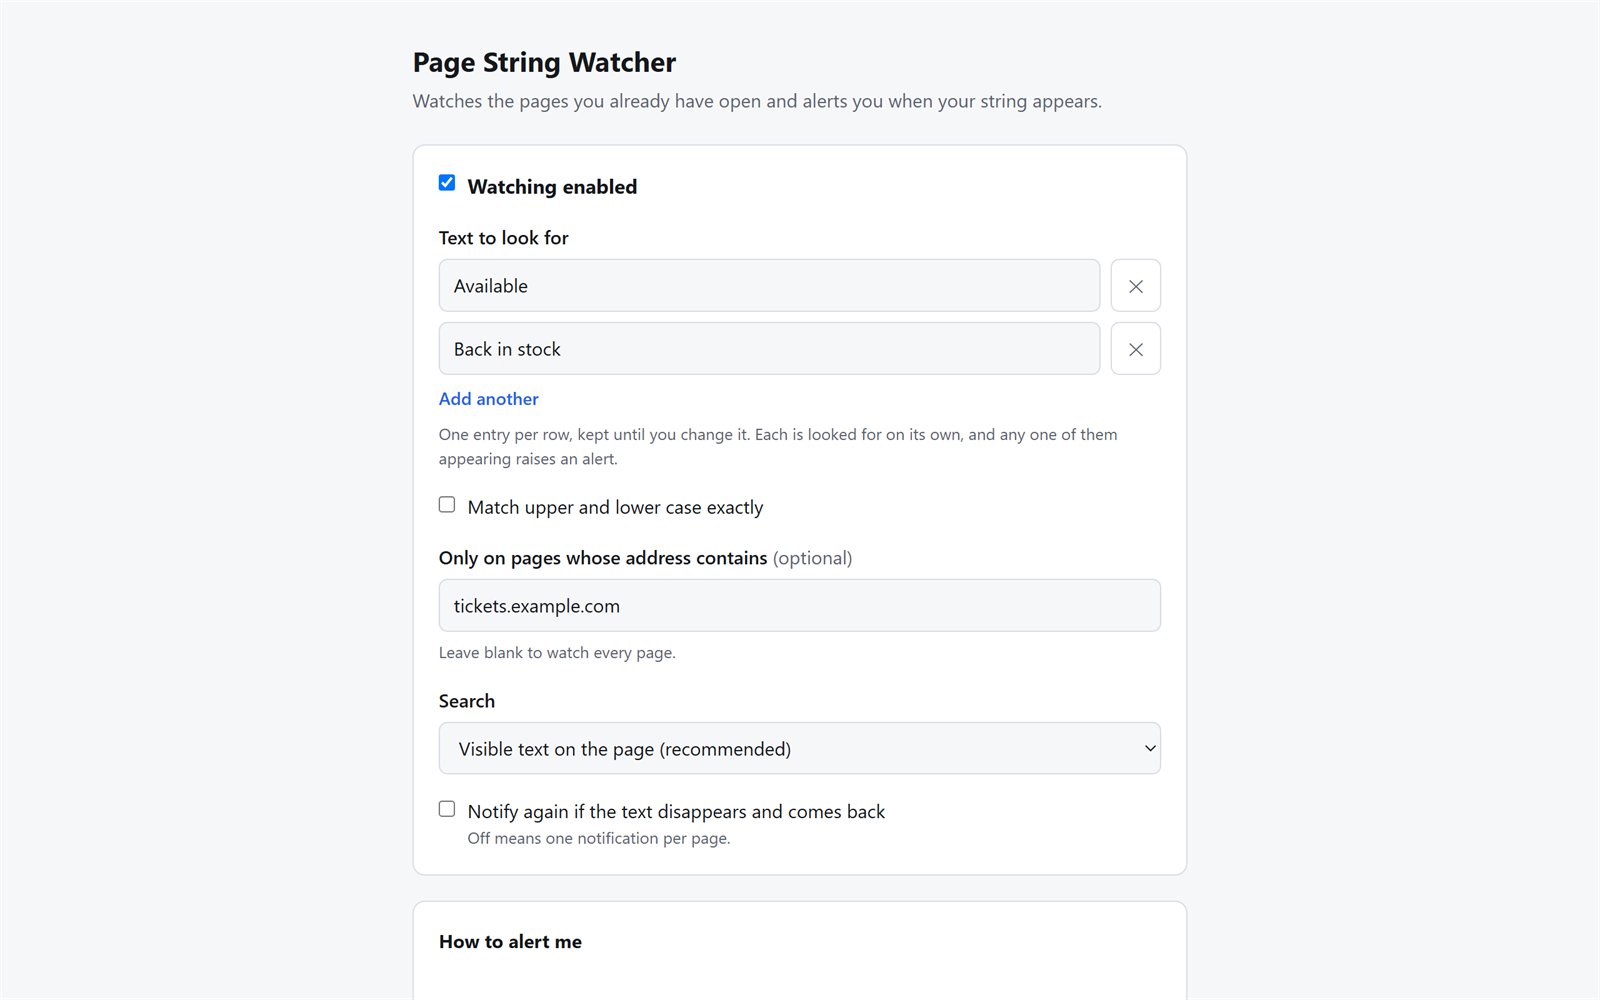
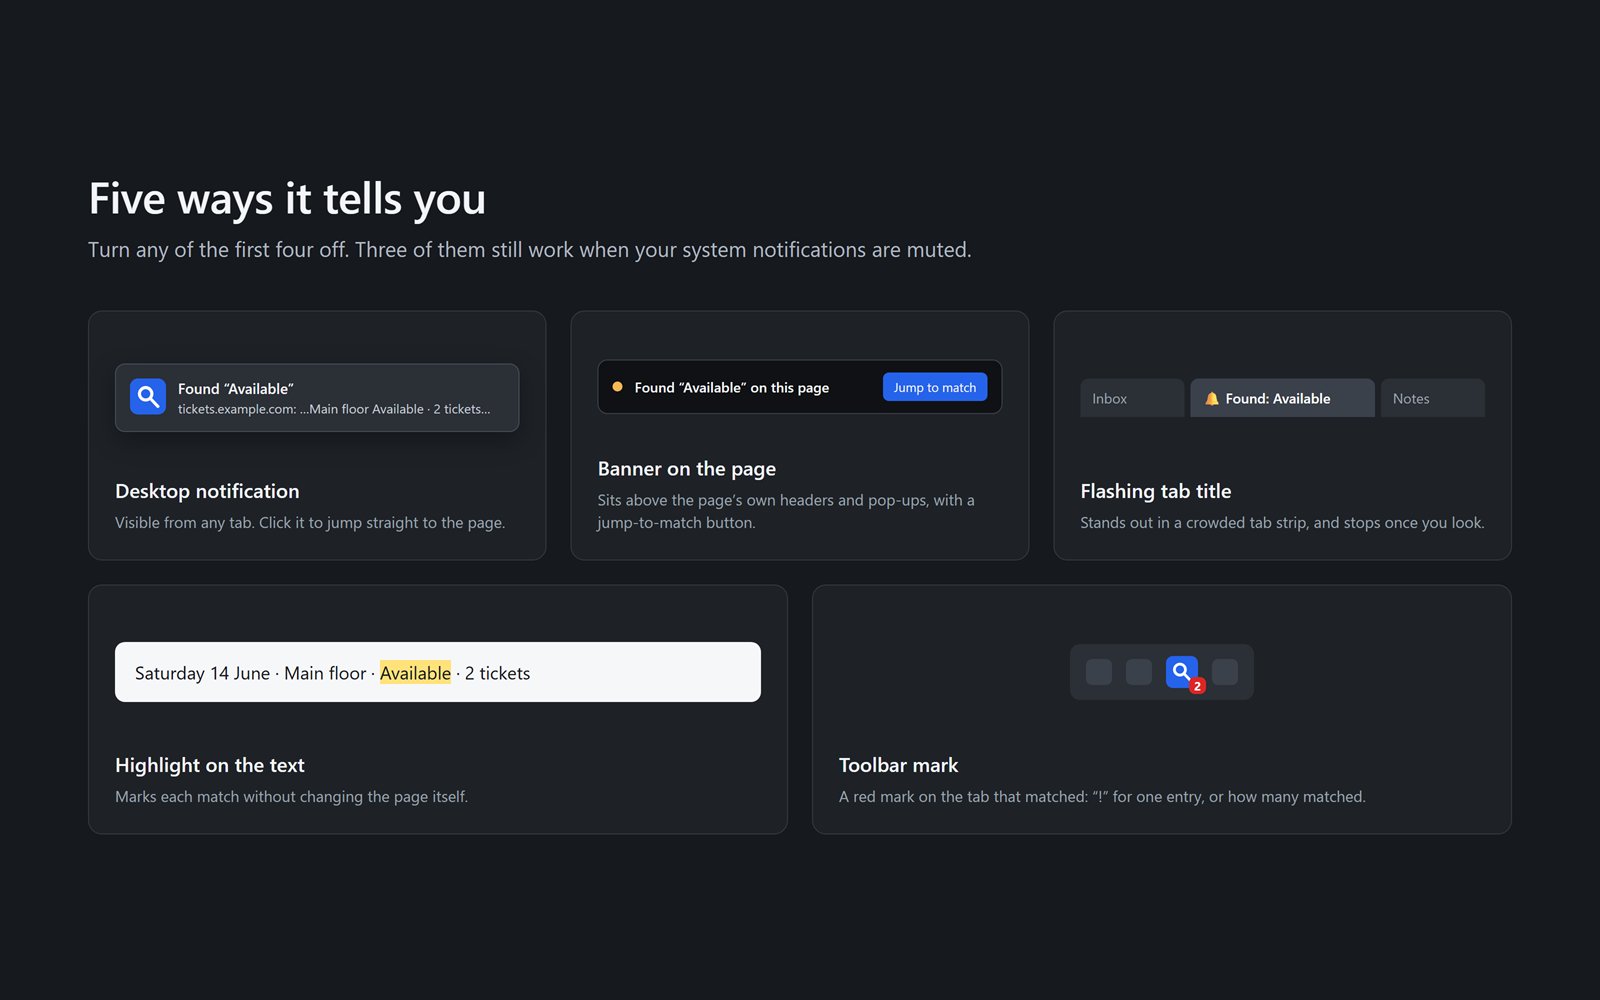
NoteExample data only: a made-up venue on example.com.
The homelab
I write the apps above at home, on a Windows 11 virtual machine on my Proxmox server, and a Linux Mint one covers development on the Linux side. The same machine runs Pi-hole for the home network and a Docker host.
The Proxmox server
- Hypervisor
- Proxmox VE 9
- CPU
- Intel Core i7-11700, 8 cores
- Memory
- 64 GB
- Storage
- 1.5 TB of NVMe
- Backups
- Manual, to the NAS
| Guest | Kind | Size | What it's for |
|---|---|---|---|
| DNS | Container | 2 cores, 2 GB | Pi-hole, answering DNS for the home network. |
| Docker | Ubuntu VM | 4 cores, 8 GB | BookStack, Gotify, Plex and LM Dashboard, managed with Portainer. |
| Windows 11 | VM | 8 cores, 16 GB | Where I write code, in Visual Studio. |
| Linux desktop | Linux Mint VM | 4 cores, 16 GB | Development on Linux, with Visual Studio Code and GCC. |
The NAS
It holds the Proxmox backups and the media Plex serves, and it syncs with OneDrive, so I keep a local copy of everything I store there.
- Model
- Synology DS920+
- CPU
- Intel Celeron J4125, 4 cores
- Memory
- 4 GB
- Drives
- Four 1 TB, RAID 5
- Runs
- DSM 7
Embedded projects
Low-power environmental sensor board
A battery-powered indoor monitor with an e-paper display, built to replace a desk unit that stopped working. It reads temperature, humidity, air quality and barometric pressure, and runs on two AA cells. The boards worked first time, and asleep it drew about 57 µA before the firmware was finished.
- MCU
- STM32L431
- Sensors
- SHT45, SGP41, BMP390
- Power
- Two AA cells, TPS613221A boost
- Write-up
- Hackaday.io
3.3 V boost converter with a button latch
A power circuit for a larger project. It boosts one or two AA cells to 3.3 V, and a push button turns it on and off through a D flip-flop, so the microcontroller it powers can also switch itself off. With the output off, it draws about 0.64 µA.
- Converter
- TPS610994
- Latch
- D flip-flop
- Off current
- 0.64 µA
- Write-up
- Hackaday.io
How it started
I've worked on a dispatch communications desk for a number of years. When I started, a lot of the work ran on information copied by hand from one place to another, things passed along by word of mouth, and long email chains that held the latest version of a procedure. There was plenty to automate.
The first thing I took on was a report we sent to a third party every day. Someone typed it up by hand, which took 45 minutes to an hour depending on how often the phones interrupted. Now a program downloads the CSV, parses it and produces the PDFs in two or three minutes.
Transport referrals came next. Six or seven of us kept them in one shared Excel sheet and edited it all day, and mistakes crept in. I replaced it with a small WPF app backed by a SQL database, and later folded both tools into one Blazor Server app. A lot has gone into it since: full fleet management, QA/QI requests for the whole department or for one person, a department-wide chat, and more. That's CommsHub, and the desk has used it every day since February 2025.
I've been programming since I bought a copy of Borland Turbo C for DOS. I've written Python, Perl, shell scripts and assembly since, on Windows, FreeBSD and Linux, but C# is the language I kept coming back to. I loved building desktop apps with it in WPF, and when the work moved to the browser I didn't want to give it up. Blazor Server meant I didn't have to.
Say hello.
I'm not taking on new work at the moment, but the form still works. Send a question about one of the tools on this page, or something to talk about later, and I'll reply.
Or email me directly:
hello@helix-2.com